Five years ago, the National Audubon Society, the century-old conservation group devoted to protecting bird populations and habitats, embarked on an ambitious plan to reinvent itself by using ArcGIS to change the way it collects and manages data.
With its roots in an 1890s movement to fight the slaughter of waterbirds for the hatmaking trade, Audubon started as a loose-knit network of state-level groups. It has long relied on that decentralized framework to reach widely and empower local efforts. But Audubon’s federated structure—with 467 local chapters and a long roster of independent, grassroots conservation projects across the Northern Hemisphere—created data-management challenges.

Reporting methods varied wildly, generating a haphazard assortment of data. Redundancies and flawed—even conflicting—datasets were commonplace. Despite the volume of information potentially available to decision makers at the regional and national levels, vital intelligence was still far out of reach.
“In that scenario, our [incoming information] wasn’t quality controlled,” said Doreen Whitley, Audubon’s geospatial information officer. “It was simply up to users, those generating spatial data, to do the best they could with the information they had. I could make maps, but I’d have to pull from back-of-napkin resources with no assurance of accuracy.”
Acquiring Situational Awareness
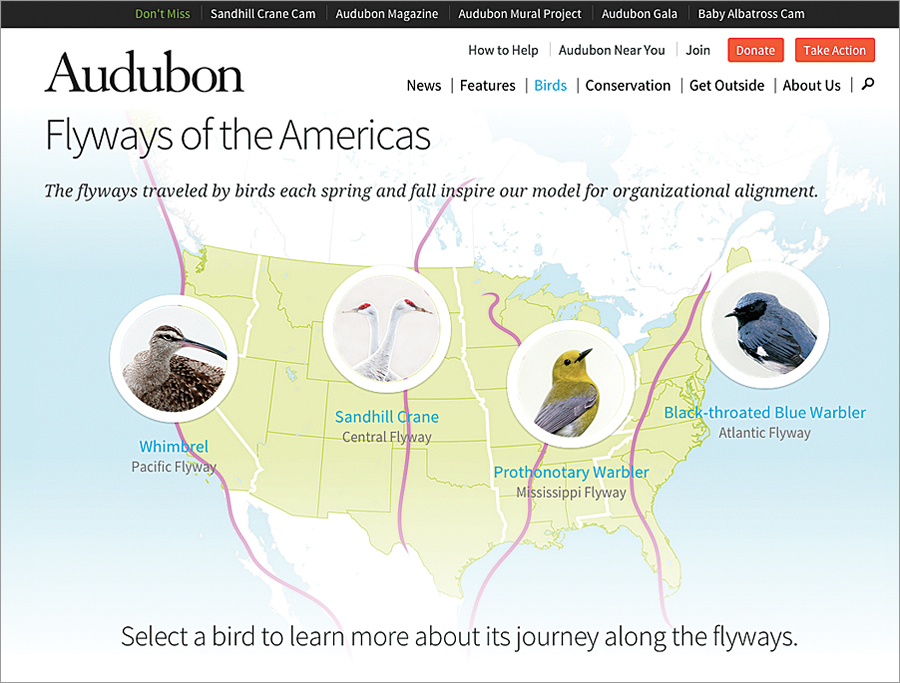
In 2010, Audubon’s leadership committed to pursuing large-scale conservation projects that would require situational awareness across multi-state regions. The group restructured itself, creating a new organizational alignment based on four North American flyways, the north–south paths traveled by migratory birds each spring and fall.
State and local chapters typically pursued independent conservation initiatives that were based on strategies that seldom reached across state lines. Audubon hoped that under this new configuration, these chapters could begin to see their efforts in the context of wider regional pictures. This new approach would reduce redundancies and promote interchapter partnerships. The database required for such an overhaul, though, simply didn’t exist.
As the first step in its retrofit, Audubon created an experimental protocol. Chapters in each north–south flyway systematically reported every four months on their progress with ongoing projects. Whitley led the effort to compile and organize the incoming data, using ArcGIS to build a comprehensive new picture of Audubon’s efforts.
“It was the first time [chapters] could see across state boundaries,” said David Yarnold, Audubon’s president and CEO. “What none of us expected was that this experience would trigger a series of management changes where a new generation of collaborative leaders took over and brought with them a ‘one Audubon’ approach to conservation that’s fired up our entire network of 4 million.”
The experiment set the stage for the development of enterprise GIS. This transition saw Audubon evolve from an organization with some 90 users of ArcGIS—each creating and managing spatial information on a local level—to an intelligence-centric culture with more than 1,000 network members using the Esri platform on a widespread basis to gain ownership of authoritative data.
That reinvention began with a cultural shift.
Molding GIS to the Culture
Audubon’s leadership faced a unique challenge: broaden the group’s use of GIS while staying true to its decentralized organizational structure.
An enterprise GIS strategy had to be molded to fit Audubon’s existing culture. In that culture, data management skills, data needs, and access to technology varied chapter by chapter. Whitley knew that, for Audubon, GIS implementation would need to be both creative and agile.
“Our goal wasn’t to create more spatial-data experts but to make it easier to access and use data,” she said. “For us, the starting point was the idea of the value of authoritative data. In any organization, whether it’s decentralized or centrally focused, the key is understanding that value and recognizing the datasets that drive your mission. Focus on those and flexible ways to distribute them. Everything grows from there.”

Whitley led an organization-wide exercise to identify core spatial datasets such as species populations, habitat locations, migration patterns, and climate measurements. The effort helped clarify the importance of consistency and accuracy in gathering and sharing geospatial information. It brought the organization together, bonding personnel through a shared newfound trust in a single authoritative dataset.
“Soon everyone in the organization appreciated that there weren’t five answers to the same question,” Whitley said. “At that point, no one’s resistant and people are looking to use geospatial data to create solutions. That’s how GIS builds connective tissue.”
Using a single server, Audubon’s GIS team input newly quality-controlled spatial data layers into ArcGIS for Server. Maps were then created in ArcMap and published as map services via ArcGIS for Server, making them available online for users throughout the organization. End users with local chapters could then incorporate the material into their own initiatives and campaigns. The value of Audubon’s data increased as its directional flow changed.
Lights Out Program
With an improved data structure in place, Audubon introduced GIS-empowered initiatives and retooled existing efforts to better use spatial information. Audubon’s Lights Out program, for example, works to mitigate the risk that migrating birds will be killed at night by flying into buildings. Many bird species migrate at night and rely on the moon and stars for navigation. Brightly lit windows in tall buildings can disorient birds, causing them to strike urban structures. According to Audubon, more than 100 million birds die annually from such strikes.
Prior to Audubon’s widespread adoption of GIS, volunteers monitoring buildings for signs of overnight bird strikes might have compiled data consisting of little more than the building’s address. Now, volunteers can use Collector for ArcGIS to record specific strike locations on a building’s exterior. Audubon has begun using Esri CityEngine to build 3D models of the environments in which these strikes occur.
The technology has changed the tone of Audubon’s conversations with building owners. Rather than requesting that all lights in a building be turned off overnight, Audubon instead asks to limit lighting in specific locations on specific floors. That change in tone has actually prompted many building owners to be voices for the Lights Out cause.
A More Collaborative Approach
“We see opportunities in these 467 chapters, with the volunteers that have committed to the organization,” Whitley said. “The more we can arm them with technology, the stronger their voices will be and the more successful they’ll be.”
Yarnold sees GIS as a vital component for nonprofits of the future. He said that organizations like Audubon will always reflect the visions of their leaders, but he adds that, in groups that embrace GIS, those visions can be shaped, refined, and strengthened by meaningful data. He expects GIS to enable nonprofits to move away from what he calls traditional models—those in which advocacy heroes make decisions while other participants are relegated to supporting roles—and shift toward more collaborative approaches in which all players have the tools and data to participate in strategy making.
A. J. Mangum is a Colorado-based writer, photographer, and editor.

