Esri’s World Population Estimate Is Now Available in ArcGIS Online
Knowing where people live is important. During a natural disaster, having information on the size and location of the impacted population facilitates better response and recovery. In a disease outbreak, being able to tell where people are acquiring the disease—and whether certain populations are in its path—is crucial. In ecological studies, humans are often the primary source of disturbance to naturally occurring habitats, so knowing where people live is instructive.
Esri has developed a new way to estimate global population—and it is now available in ArcGIS Online. This method combines information from datasets on global land cover, roads, and place-names to produce a probability surface. The probability surface is calibrated using census data and, where there is none, national population estimates to calculate residential population.
This World Population Estimate (WPE) map, originally released in December 2014 with an update scheduled to come out summer 2015, is the brainchild of Earl Nordstrand, a senior researcher at Esri with more than 35 years of experience in geography and GIS. A geographer by training, Nordstrand has always been interested in demography and spatial analysis. For years he led Esri’s data team, which produced the first versions of Business Analyst, a complete GIS software system that helps businesses understand customers, competition, and market trends. Over the past few years, however, he has worked exclusively on refining the model for producing global population estimates.
Why the WPE Is Unique
The WPE is different from other estimates of global population, though they all have their merits. For instance, the Gridded Population of the World (GPW) dataset from the Center for International Earth Science Information Network (CIESIN) at Columbia University illustrates the distribution of humans around the world, but the dataset is based on census data so it does not get very specific in locating rural populations. LandScan, from Oak Ridge National Laboratories, models ambient population—where people are located on average over a 24-hour period—which essentially shows where people are during the day but not where they live at night.
The WPE, an analysis-friendly raster surface, displays where people live—and establishes where people do not live.
How the WPE Works
Nordstrand’s method starts with land-cover data from MDA Information Systems LLC’s NaturalVue, natural-color satellite imagery of the world capable of defining areas with surface water and permanent snow or ice—that is, places where people do not live. These locations can be eliminated from the WPE’s population estimates. Nordstrand’s method also uses a texture-detecting model to find areas with high levels of texture, often indicating buildings and roads, which suggest where people may live.
Nordstrand uses additional data, such as road intersections and areas with extreme climates, to increase the specificity of where people are likely and unlikely to take up residence. To avoid arbitrarily eliminating known populated places, he uses place-name points from GeoNames, a geographic database that contains more than 8 million location names. But that does not define how large or spread out these places are, so Nordstrand employs census data where it exists to do that. In some cases, census data identifies airports, industrial complexes, and the like—more places where people do not live.

Based on this, plus additional information sources, each cell in the WPE raster is populated with an estimated count of people living within that cell.
Where People Live
Using data from 1990 to 2013, the WPE estimated that the number of people in the world in 2013 was 6.89 billion, which is consistent with other world population estimates for that time. When Esri staff evaluated the data, they found that if they defined urban areas with a density of 2,500 persons per square kilometer, then the WPE shows that 55.5 percent of the world’s population is urban, while 41 percent is rural.
Per the World Bank, the earth contains a little more than 129.7 million square kilometers of land area (not including inland bodies of water or Antarctica). The WPE shows that humans live on 7.9 percent of this land area, with urban areas occupying only 0.56 percent of the earth’s surface. That means that more than half of the world’s population lives on less than 1 percent of land area.
Ongoing Development
The WPE is still being expanded and improved. In the map’s initial release, Esri staff assessed that the information about the remaining 3.5 percent of the population, ostensibly living in very rural areas, is unreliable. This is because in areas where the number of people estimated to be living within a cell is fewer than 25, the land-cover data was not very accurate, making texture detection more difficult. For example, in agricultural areas, many textures being identified are barns and outbuildings. As textures, they increase the probability that more people live there; but in this case, that probability may be artificially high.
Nordstrand acknowledges that the WPE’s first release contains some uncertainties about extremely rural areas. Indeed, he has already addressed this by weighting each land-cover class (grassland, urban, or water, for example) with a baseline probability so that when a texture is detected, the WPE will know that human settlement is most likely the reason for it. Additionally, Nordstrand began using a new, higher quality land-cover dataset from MDA called BaseVue as the basis for land-cover classification. The resultant estimate will be available in summer 2015.
Using the WPE
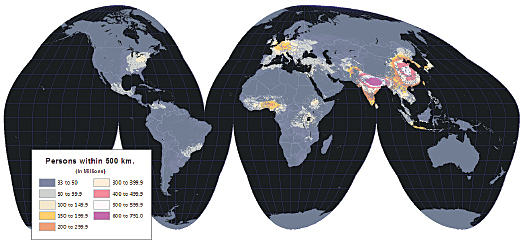
The WPE yields new ways of looking at the world’s population. For instance, it can find the world’s most crowded locations while excluding political boundaries and biases. In fact, the five most crowded places on earth, irrespective of city borders, are Jakarta, Indonesia; Delhi, India; Dhaka, Bangladesh; Tokyo, Japan; and Shanghai, China. According to political boundaries, however, Tokyo is the largest, followed by Jakarta.
The WPE’s calculation of crowdedness works by using ArcGIS to count the people within certain radii of each one-kilometer cell of Nordstrand’s data. To give a practical example, Los Angeles, California, is only the twenty-fifth most crowded city in the WPE when the analysis is run with a 40-kilometer radius. That is because there is no location within or near the city’s WPE cells that has even half as many people as there are within a 40-kilometer radius of cells in the top five cities for this measurement.
The Bigger Picture
Objective global population datasets such as the WPE are essential for analyzing how humans—as agents of change, stewards of land, and consumers of resources—affect their surroundings and the state of the earth. And with more attention being given to climate issues, with mandates such as US president Barack Obama’s 2013 Climate Action Plan and the US Congress’s 2014 Global Climate Change Initiative, being able to understand global issues in unbiased, comparable ways is becoming more important.
In addition to the WPE, Nordstrand’s method produces a set of point features with population counts. With nearly a billion locations represented, these point features are big data. The geographic data enrichment tools that add demographic and lifestyle data to maps depend on those points to describe the characteristics of local populations in countries that lack censuses or that do not make detailed census data available. Esri uses these point features behind the scenes in software such as Business Analyst Online, Community Analyst, and Esri Maps applications.
It is Esri’s hope that people will use the WPE, plus additional global datasets in ArcGIS Online, to gain more awareness about what it means to have 7.3 billion people on earth today.
Users with ArcGIS Online organizational accounts can access the World Population Estimate for free and use it throughout the ArcGIS platform to help with visualization and analysis.

