Australian State Maps All Its Floodplains and Catchment Areas
Online Exclusive
Queensland, located in eastern Australia, had the wettest December on record in 2010. Heavy rainfall averaging 8.25 inches covered the state, resulting in a series of floods in more than 70 towns, forcing the evacuation of thousands of people; flooding out several coal mines; and wreaking havoc on banana and sugar cane crops, which account for much of Queensland’s economy. Infrastructure, including rail lines and roads, was washed away.
Only three weeks after this flooding, on February 3, 2011, Severe Tropical Cyclone Yasi made landfall in northern Queensland. The category 5 cyclone crossed the coast at popular Mission Beach, a small resort that contains two World Heritage sites. While floodwaters destroyed floors and foundations of buildings, Hurricane Yasi ripped off roofs and toppled trees. More than 30 people lost their lives, and the economic toll from the devastation was around $6.8 billion.

Queensland’s Department of Natural Resources and Mines (DNRM) played a significant role in responding to the catastrophe by coordinating and providing imagery, flood mapping, and online access to important spatial information that was needed by first responders and the general public. DNRM is responsible for mapping and GIS for the state of Queensland. Using the ArcGIS platform, DNRM provided one source of data for all responders, including the Australia Defence Force; Emergency Management Queensland; the Insurance Council of Australia; the Bureau of Meteorology; local, state, and federal agencies; and nongovernmental organizations.
Cartographers to the Rescue
When record levels of rain were forecast by the Bureau of Meteorology, DNRM began planning to acquire aerial photography to record the peak flood event in the major population centers around Queensland. An existing research and development project with satellite imagery also allowed the agency to collect images of the area, since December and January are not typically good months for aerial photography because of seasonal cloud cover.
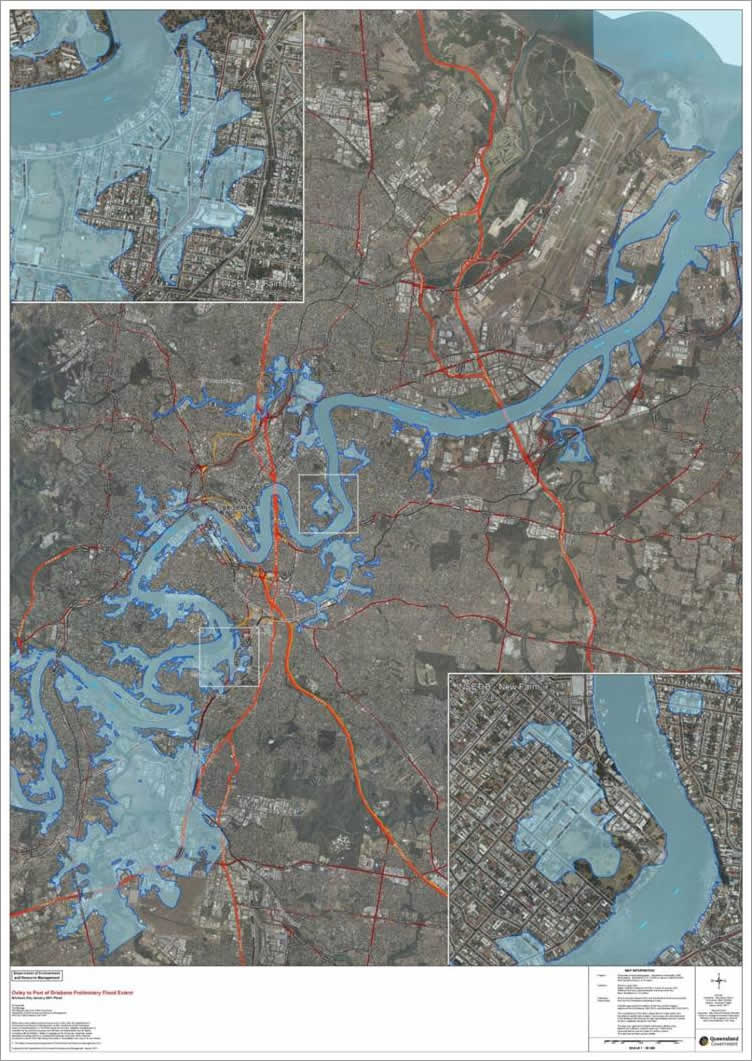
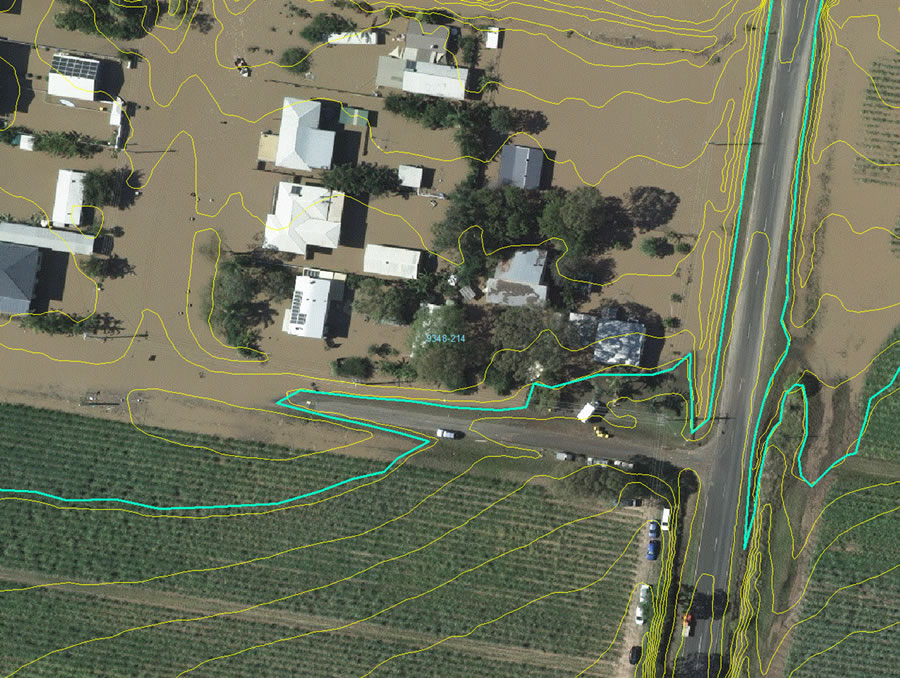
Once collected, a team of 35 cartographers used the imagery to identify flood lines. If imagery was collected after the flood peaks, the cartographers were able to identify the flood events using contours and flood debris line identification through aerial photo interpretation. Flood lines were initially identified for the capital city and later for all towns affected by floodwater. Floodplain mapping for all of Queensland was completed in seven months, producing 8,875 maps for 118 river subbasins at 1:50,000 scale.
DNRM published these maps online with the help of Esri Australia Pty. Ltd., Esri’s distributor, through two websites using ArcGIS for Server and the Amazon Elastic Compute Cloud. These sites were launched at the end of February, just a couple of weeks after Yasi hit, and displayed imagery of the floods, delineated flood lines, and provided other relevant information. These sites allowed the public to view and comment on the accuracy of the information provided and access both before and after maps as PDF documents.
To prepare damage assessment maps for the Queensland Fire Brigade, map books were created using automated Python scripts and ArcGIS 10. Before automation, it took more than seven hours to publish large subbasins to PDF. By using Data Driven Pages, this process was cut one hour and even allowed the cartographers to edit the data while it was being published.
Better Insurance, Faster
Rapid damage assessment data captured by emergency services was assessed against polygons of wind level classifications, the digital cadastre database, and imagery to ensure the quickest possible processing of insurance claims. The flood lines were used to identify flood-affected homes and businesses to grant emergency relief funds and later to assist with insurance payouts. Insurance payouts went swiftly thanks to the ability to geocode all the applications and check them against the mapped flood lines. Using ArcGIS for Desktop, the claims could be verified in this manner rather than spending significant time on field inspections. Even then, it was a seven-day operation to process the 21,400 applications that were received. Using ArcGIS, much time was saved in verifying and delivering payments to those who had suffered damage to their property. Homeowners could move back in, and businesses could open their doors that much quicker.

Spatial imagery and the resultant flood lines have become critical products and a key record for insurance processing, creating metrics for affected properties, businesses and infrastructure, planning and reconstruction, tax concessions, and relief claims and as a matter of critical record during commission of inquiry.
A Portal in the Storm
As the extent of the devastation became apparent, the potential to use the websites to communicate with the public during and after the floods was realized, and more data was made available to support other possible water-related disasters through an online information portal. The portal allows people to discover risk through viewing and exploring the ArcGIS maps and reports and then access data through an online catalog and delivery system.
The portal was released in phases beginning in October 2012. The first phase included a Queensland Government Flood Information Portal app tailored to four main themes. The first is risk discoverability that includes probability-related spatial layers and explanation linkages. The second is a historic flood study inquiry that includes property flood certificates. Third is a data portal containing a flood study report and technical modeling data. Last are predictive scenarios, such as riverine flood extent and storm surge inundation.
The app has a current, spatially enabled database of historic flood studies from the Queensland flood study database that is the authoritative source for the public dissemination of emergency data, including predictive flood, as well as storm tide, inundation areas. The app automatically includes relevant information into the commonwealth government’s Australian National Flood Information Database. There is scheduled maintenance of the Queensland flood study database, and it includes a provision to generate property flood certificates.
Queensland is now the only state in Australia to have mapped all its floodplains and catchment areas. As a result, the location and extent of its floodplains are known—26.6 percent of the state’s entire area and the communities that reside on or alongside them have been discovered—442 towns in rural areas. This comprehensive view is indispensable for further examination of flood hazards and the assessment of the best ways to handle them when they occur.
For more information, contact Peter Lennon, director, Spatial Data and Mapping.

