By Chris Shuler, Mike Mezzacapo, and Melanie Lander
A Problem in Paradise
The Hawaiian Archipelago, set in tropical blue waters and lined with picture-perfect, white-sand beaches, attracts nearly 10 million visitors each year. But beneath the surface, an estimated 83,000 cesspools leak about 53 million gallons of untreated wastewater into the ocean each day. Cesspools, the most rudimentary of on-site wastewater systems, are common across the islands.
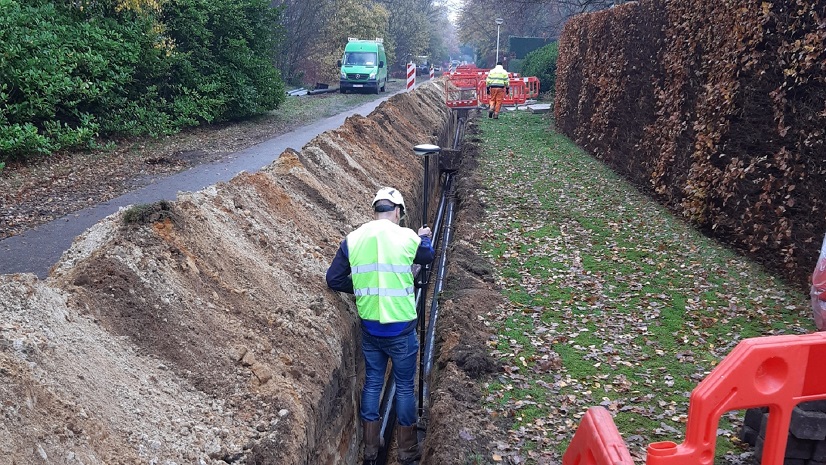
A cesspool is simply an underground pit or porous tank that is used to collect wastewater. The cesspool is literally the oldest known wastewater disposal technology, dating back to ancient Babylonia in 4000 BC. In the U.S. they were commonly used in areas without access to a centralized sewage system. Now, due to environmental regulations, more advanced systems like septic tanks are generally required. Cesspools are typically made from concrete, brick or stone, and have porous walls or an open bottom to allow the water to seep into the surrounding soil. Wastewater from cesspools not only contaminates coastal waters with harmful bacteria and coral-choking nutrients, but also impacts drinking water supplies and inland aquatic environments.
In 2017, Hawaii’s state legislature took decisive action to address the widespread contamination threat posed by cesspools across the islands. Act 125 mandated the replacement of these substandard wastewater systems by 2050 and signaled the start of an ambitious journey to protect Hawaii’s drinking water, coastal ecosystems, and public health.

However, with Hawaii’s diverse landscapes—from densely populated neighborhoods to rural coastal zones—implementing this mandate is a formidable undertaking. Breaking the process down into systemic and manageable steps is essential. In this case, the first crucial step was to prioritize which cesspools were most important to replace based on their potential impacts. Previous prioritization methods depended on limited and expensive water quality studies of individual areas. However, a legislative task force created by Hawaii Act 132, the Cesspool Conversion Working Group (CCWG), recognized the need for a more sophisticated, data-driven tool to ensure fair and effective prioritization across the state.
To meet this challenge, a partnership between the University of Hawaii Water Resources Research Center, the Hawaii Sea Grant College Program, and the Hawaii State Department of Health was established to create the Hawaii Cesspool Prioritization Tool (HCPT). The tool was developed with advanced GIS methodologies, leveraging the ArcPy modules along with diverse datasets to perform transparent and reproducible spatial analysis of cesspool-derived environmental and public health impacts. By integrating data on groundwater flow, proximity to drinking water sources, ecological sensitivity, and sea level rise projections, the GIS framework enables a targeted, risk-based cesspool replacement timeline across Hawaii.
Transforming Data into Actionable Insights: The Development of the HCPT
Creating a targeted cesspool replacement plan for Hawaii presented an immediate challenge. The sheer number and geographic spread of cesspools across Hawaii’s diverse landscapes required a tool that could simplify complex, site-specific data into actionable insights for managers, community organizations, and the public. For this effort, accurate data was fundamental, yet the state’s understanding of cesspool locations and their impacts was limited. Existing records lacked the detail needed to guide policy effectively, making it essential to leverage knowledgeable experts and robust datasets to create a more accurate cesspool inventory and a comprehensive set of risk factors.

To individually assess 83,000 cesspools, powerful GIS capabilities and efficient database management were essential. The HCPT was designed to address this massive volume of data and complexity by integrating diverse environmental risk factors—ranging from groundwater proximity to coastal exposure—in one platform. ArcPy, a Python library within ArcGIS, became instrumental in automating the analytical workflows needed to assess each cesspool’s impact. ArcPy’s robust scripting capabilities enabled the project team to efficiently manage large datasets and define complex relationships across layers. This approach allowed the HCPT to handle intricate dependencies among datasets and assign meaningful risk scores to each cesspool.
Whether assessing proximity to drinking water sources, mapping groundwater flow, or predicting coastal flooding from sea level rise, ArcPy automated calculations that would otherwise be unmanageable. This workflow allowed our team to organize, analyze, and visualize data statewide, turning disparate data points into clear, actionable insights that directly inform prioritization efforts.

The approach involved assessing each cesspool against 15 critical risk factors, each chosen to represent specific environmental, health, and infrastructural impacts. These factors included:
- Distance to municipal or domestic drinking water wells
- Distance to domestic drinking water wells
- Intersection with well capture zones
- Distance to streams and wetlands
- Distance to coastline
- Intersection with projected sea level rise zones in 2030, 2050, and 2100
- Average annual precipitation
- Depth to groundwater
- Soil characteristics
- Cesspool density
- Coral cover
- Fish biomass/recovery potential
- Coastline user-days
- Proximity to lifeguarded beach
- Coastal ocean circulation proxy
The HCPT scored each of Hawaii’s 83,000 cesspools based on individual interactions between the cesspool and each of the 15 distinct risk factors. Every risk factor had to be geographically related to each cesspool point in a different way. These relationships included proximity to features such as drinking water wells or coastal areas; intersections between cesspools within a feature such as a well capture zone; and modeled parameters such as depth to groundwater. To account for cesspools located inland that still impact coastal waters, groundwater flow paths calculated with hydrologic models and digital elevation models (DEMs) were used to trace the most probable discharge location for each cesspool. This enabled the HCPT to determine which sections of the reef or coastal ecosystems were at risk of wastewater contamination. Each cesspool was then assigned a score for each risk factor, representing its relative impact on a given resource.

Integrating Expert Insights for a Comprehensive Prioritization Framework
Each of the 15 risk factors was also assigned a specific weight based on its significance. Factors like proximity to drinking water sources were deemed more critical than others, such as proximity to recreational beaches. To establish these weights, the project team organized a series of workshops with experts from various fields, including coastal ecosystems, water resources, and wastewater management. During these sessions, experts discussed and assigned weights to reflect the relative importance of each factor. Between the workshops, a survey was distributed among the experts, soliciting a proposed score for each risk factor.
The score assigned to each risk factor was multiplied by its weight, and these weighted scores were summed to generate a single, comprehensive prioritization score for each cesspool. While this scoring system provided a high-resolution ranking for individual cesspools, comparing fractional differences in impact wasn’t useful for management decisions. To streamline the process, cesspools were grouped geographically into census units—tracts, block groups, and blocks. The average risk score for each census unit was calculated (excluding areas with few or no cesspools), reducing the data from 83,000 individual scores to less than 200 for tracts and a few thousand for blocks.

These scores were further simplified into three priority zones: census units and their cesspools in the top quartile were classified as Priority 1, those in the second quartile as Priority 2, and the remaining two quartiles as Priority 3. This framework took over 1.3 million individual geographic relationships and distilled them into a straightforward, three-tier priority system, providing clear guidance for policymakers and managers in directing cesspool replacement efforts. Statewide, over 13,000 cesspools fall into high-priority zones.
Developing Interactive HCPT Tools for Stakeholders
To make the HCPT accessible and useful for diverse users, from policymakers to residents, we focused on building a transparent and interactive platform. The goal was to provide not only the data, but also an intuitive, user-friendly interface to explore it. The framework and code base for the HCPT, including input data, the open-source scripts, and the output results, were deployed on GitHub, providing a permanent, open-access repository for archiving the process and for public viewing. However, because users need more than just shapefiles or static maps, we also utilized Esri’s Web AppBuilder Developer Edition to create an interactive web viewer.
This platform enabled us to customize JavaScript libraries, allowing for essential adjustments such as nesting layers for cesspool points with each risk factor. This setup enables users to visualize both cesspool scores and the associated risk factor data together. We created two separate applications: one displaying prioritization scores within geographic census areas, and another showing all input risk factors with color-coded scores for each cesspool in relation to these factors.

Reaching End Users
The HCPT is full of information ripe for decision-making, but its audience is composed of a wide spectrum of Hawaii’s population. The tool was created for everyone from everyday homeowners to policymakers and expert researchers. In order to communicate the tool’s findings, how it works, and its variety of uses, a website and series of videos were created. The site serves as a literal and figurative entry point to the topic of cesspool conversion, supports consistent messaging, and provides a multimedia platform to educate the community about the impacts of nonpoint source wastewater pollution on human health and the environment. The site provides detailed instructions on how to navigate within the HCPT, as well as a succinct summary of the steps taken to determine priority areas.
Supporting Policy, Community Outreach, and Workforce Development
The HCPT is beginning to play a key role in shaping state and local policies around cesspool replacement and wastewater management. The Hawaii State Department of Health (DOH) has used prioritization zones from the tool to set eligibility criteria for the Cesspool Pilot Grant Program (CPGP), ensuring that limited resources are allocated to cesspools with the highest risk to environmental and public health. Kauai County also adopted the tool as part of its $2 million cesspool conversion grant program. The HCPT was referenced in several Hawaii state legislative bills aimed at addressing cesspool remediation and replacement. The incorporation of HCPT into policy discussions highlights its value as a foundational resource for data-driven decisions and targeted funding for wastewater improvements. The tool is also being utilized by the US Environmental Protection Agency (EPA) Region 9 offices for its large-capacity cesspool mapping efforts, incorporating several layers from the HCPT into their own tool to support inspections and management briefings.
“The HCPT is a valuable tool for the State’s Department of Health staff to assist with developing new policies regarding cesspools and conducting future outreach and education to communities. The HCPT was critical in identifying high-priority areas in the state where cesspools are adversely impacting the environment by contaminating our valuable drinking water resources, beaches, streams, wetlands, and coral reefs.”
Local nonprofit organizations have even integrated the tool into community town halls and outreach events to engage the public on wastewater impacts and conversion needs. The HCPT project has fostered opportunities for the next generation of environmental data specialists. As a university-based project, the team incorporated numerous undergraduate internships that contributed to its development. Through hands-on research, these students gained valuable GIS skills. By supporting policymaking, community engagement, and skill building for future specialists, the HCPT is more than a mapping tool—it’s become a catalyst for change in how Hawaii approaches wastewater management and environmental resilience.

Looking Ahead: Expanding HCPT’s Capabilities and Applications
For the first time, managers and homeowners alike have access to a clear visualization of cesspool pollution risks and the urgency behind the recommended upgrades, which can sometimes exceed $40,000. Building on this foundation, the HCPT’s GIS capabilities offer exciting potential for future expansions, allowing for additional layers and datasets to enhance prioritization and decision-making. Hawaii’s Act 217, passed in 2024, has provided our team with the opportunity to update the HCPT to include additional layers that cover planned and likely locations for centralized sewer upgrades. These additional datasets will provide homeowners’ county managers with valuable insights when making costly infrastructure decisions.
“As part of Wastewater Alternatives and Innovations (WAI)’s commitment to protecting Hawaii’s water resources, we use the HCPT to strategically guide our outreach and legislative efforts. The tool allows us to identify high-impact cesspools and advocate for funding to support low- and moderate-income homeowners.”
As a model for other regions facing similar water quality challenges, the HCPT demonstrates the critical role of GIS in supporting environmental health initiatives and informing public infrastructure planning. By identifying and prioritizing the areas most vulnerable to contamination, Hawaii is taking decisive steps toward a safer, healthier future, addressing this essential environmental issue with both efficiency and equity.
Learn More:
www.hawaiicesspooltool.org or contact cshuler@hawaii.edu
Stay Connected with Esri’s Water Team
ArcGIS is an extensive information system that enables modernization of workflows with easy-to-use applications for the field and office. Strengthen your organization with smart water solutions that will increase efficiency and provide insight for decision-makers. Visit the Esri Water Utilities web site for more information.
Join the Water Utilities Community
Follow #EsriWater on social media: X | LinkedIn
Subscribe to the Water Industry newsletter “Esri News for Water Utilities and Water Resources“
About the author