Following the State of California’s ambitious commitment to conserving 30 percent of land and waters by 2030, the California Natural Resources Agency mobilized to develop an interactive engagement hub featuring a series of informative web applications to support public engagement and exploration of the state’s Pathways to 30×30 strategy. With over 100 countries now committed to 30×30, this blog article showcases California’s technical approach as a contribution to global conservation efforts.
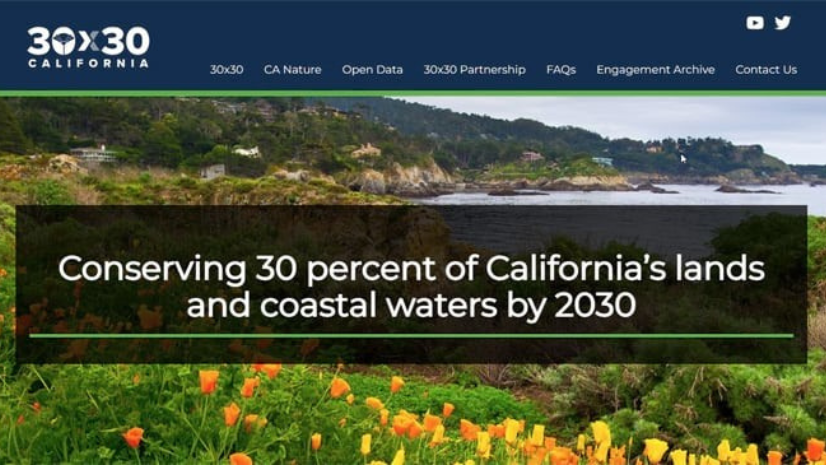
California’s Commitment to 30×30
Launched in 2020, 30×30 is a global initiative that aims to protect 30 percent of the earth’s land and water by 2030. The initiative recognizes the need for conserving nature and natural areas to mitigate climate change. So far, over 100 countries have committed to the effort.
In October 2020, California Governor Gavin Newsom issued the Nature-Based Solutions executive order elevating the role of natural and working lands in the fight to mitigate climate change and advance biodiversity conservation. The executive order commits California to the goal of conserving 30% of its lands and coastal waters by 2030 and aims to adopt nature-based solutions to meet the challenge of climate change in a manner that protects biodiversity among multiple goals and improves equitable access to nature for all Californians.
The executive order also directs the California Natural Resources Agency (CNRA) to coordinate with other state agencies and diverse partners to achieve conservation goals. Over the past two years, through a collaborative and inclusive public engagement process, CNRA gathered expert opinions and asked people around the state for viewpoints to determine the best opportunities and strategies for achieving 30×30.
CA Nature
As part of its role as the lead agency for the initiative, CNRA developed a geospatial infrastructure, known as CA Nature, to support current and future conservation planning for the state. This infrastructure, which is made accessible and opens using a hub site, https://californianature.ca.gov, is powered by rich geospatial data holdings drawn from a wide array of state agencies. The state data is augmented by federal data and authoritative content from Esri’s ArcGIS Living Atlas of the World.
The hub and associated applications were developed through a collaboration between CNRA and Esri, combining conservation expertise and a deep understanding of needed data, processes, and applications. CA Nature brings together a suite of interactive mapping and visualization tools for compiling statewide biodiversity, access, climate, and conservation information to advance 30×30. CNRA and Esri designed these apps to support the three main objectives of CA’s 30×30 initiative: to protect and restore biodiversity, mitigate and build resilience to climate change, and expand equitable access to nature for all. The explorer apps were built to provide stakeholders with deeper insights into these three objectives so that this information could be leveraged and provide additional context to help make conservation decisions.
CA Nature brings this data together enabling visitors to analyze and understand different features of the landscape and conservation efforts. Visitors to the hub can use its Explorer apps to identify places across California where there are opportunities to achieve biodiversity, climate, and equity goals, and to assess what percentage of California is already conserved as well as track progress toward goals.
Collaboration, transparency, and engagement are key to the success of 30×30. CA Nature delivers ways that stakeholders, government organizations at all levels, and all Californians can come together and gain understanding to meet goals.
Explorer Applications
CA Nature’s interactive Explorer applications enable everyone to engage with data in new and significant ways. The apps provide subject-specific opportunities to dig in and develop insights into the challenges and opportunities that California faces as it works toward the goals of 30×30 and implements climate-smart land strategies. The Explorer apps are as follows:
Conserved Areas Explorer
This dashboard brings together conservation successes from across the state, tallies their contributions toward the 30×30 goal, and enables the exploration of data being used to track this progress.
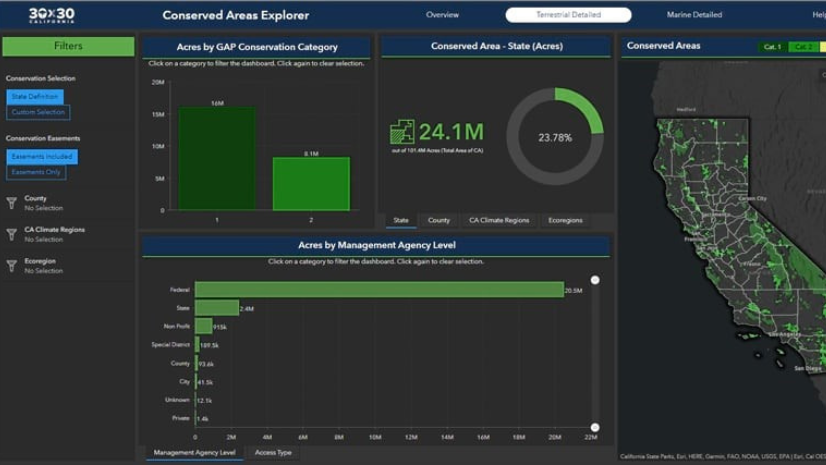
The California Protected Areas Database (CPAD) is a GIS dataset depicting lands that are owned in fee and protected for open space purposes by over 1,000 public agencies or non-profit organizations. PAD-US, maintained by the United States Geological Survey (USGS) contains core information about conservation status.
Similarly, the California Conservation Easement Database (CCED) contains details on easements within California. Incorporating these datasets and updating some areas based on known management activities resulted in the Conserved Areas Explorer which provides a Statewide view of conserved areas.
California’s 30×30 initiative uses the USGS GAP Status Codes as a measure of management intent to conserve biodiversity. Generally, GAP Status Codes 1 and 2 represent areas with strong biodiversity protections that are considered 30×30 conservation areas, therefore contributing to the 30×30 goal. GAP Status Codes 3 and 4 represent known opportunities for improved conservation measures.
Biodiversity Explorer
California is home to one of the greatest displays of biodiversity in the nation and the world. The challenge posed by the 30×30 initiative is to plan and implement conservation strategies that allow all Californians to continue to flourish and succeed, while also ensuring that we safeguard the great abundance of species that reside in the state and, in many cases, exist nowhere else on earth.
The Biodiversity Explorer app draws from several key datasets of the Areas of Conservation Emphasis (ACE) project compiled by the California Department of Fish and Wildlife. The app contains the ACE Biodiversity dashboard and the Habitat and Land Cover dashboard.
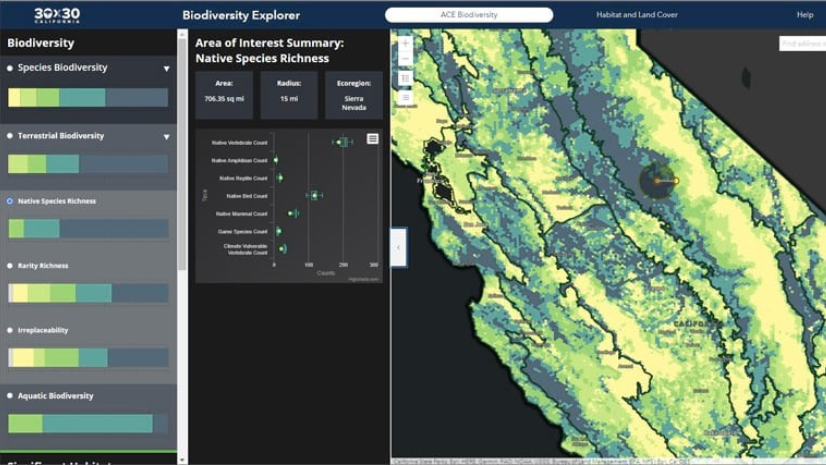
The Biodiversity Explorer introduces multiple types of biodiversity data for stakeholders to consider when engaged in conservation planning, depicting landscape areas and the ways in which biodiversity is distributed within them.
Climate Explorer
California is doubling down on efforts to achieve carbon neutrality and improve resilience to the impacts of climate change. While the effects vary across California, every area of the state is already experiencing climate change impacts. The best available science tells us that these will continue into the future and will include higher annual temperatures; changes to precipitation patterns such as longer and more intense droughts; increases in wildfire size and severity; sea level rise; ocean warming; and the spread of invasive species.
The Climate Explorer contains interactive viewers that allow users to explore predicted changes in temperature and precipitation; sea level rise and storm severity; and opportunities to implement nature-based solutions, which are actions that work with and enhance nature to help address societal challenges on California’s landscapes.
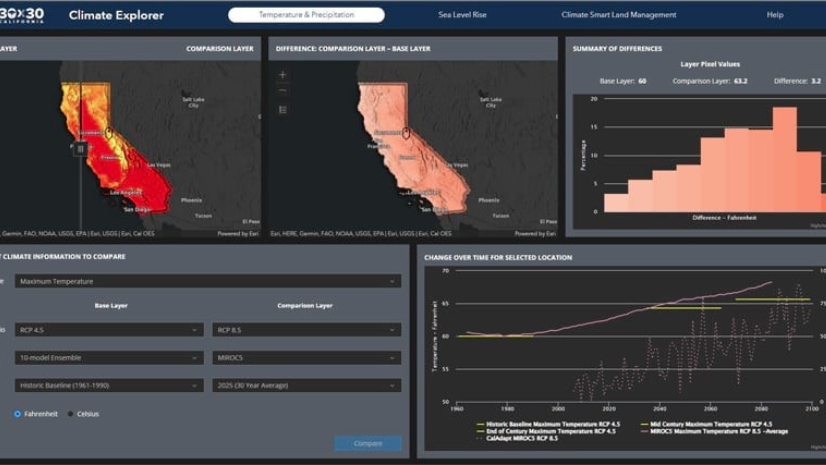
The temperature and precipitation viewer provides access to a subset of the data developed for California’s Fourth Climate Change Assessment and made available through Cal-Adapt. The Sea Level Rise viewer includes data from the US Geological Survey’s Coastal Storm Modeling System (CoSMoS).
Access Explorer
The California Natural Resources Agency’s Outdoors for All and 30×30 initiatives set a goal of equitable access for all to the state’s natural and open spaces. This dashboard helps illustrate the current status and challenges and highlights opportunities.
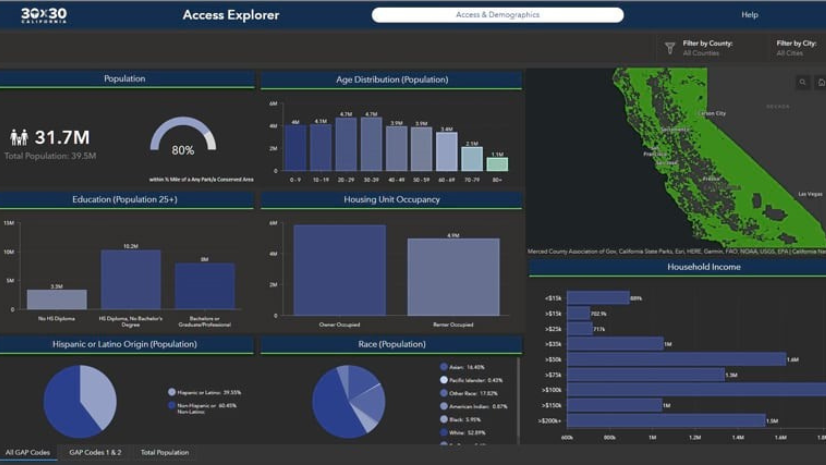
The Access Explorer offers statewide demographics of the population that lives within a half mile of any open space—such as a park with public access—contained within the Conserved Areas database, whether or not it meets the definition of a 30×30 Conservation Area.
These demographics can be compared to areas that are 30×30 Conservation Areas as well as to the population overall. Filters can be used to review city and county details.
Democratization of Data and Analytics
Enabling a wider audience to access the data components used in CA Nature, as well as performing analytics to explore custom scenarios, is an integral part of California’s vision for 30×30. These are supported in two ways: via an open data site and via the Conservation Opportunities Modeler.
Open Data
For conserving 30 percent of California’s lands and coastal waters by 2030, data is essential to inform targets, identify opportunities, and validate that goals are met. It is incumbent on the state to provide this data in an open and transparent fashion.
Open data delivers access to the data and tools used by CA Nature, democratizing access to its core information. It’s searchable by text or by subject area. Filtering options can be used to refine results by data source or date published, or view results associated with additional CA Nature categories or source agencies.
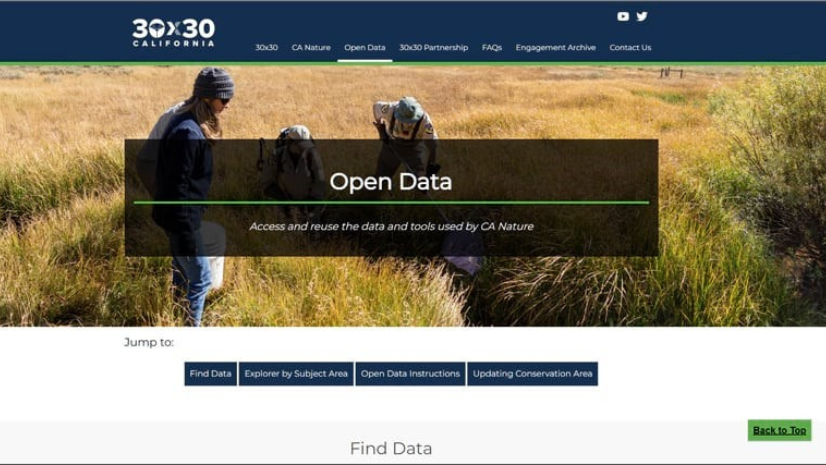
Once you have found a dataset of interest, with a few additional clicks you can create a map directly in your browser, change colors, and include additional datasets.
Conservation Opportunities Modeler
The Conservation Opportunities Modeler integrates data across themes within 30×30 and climate-smart land strategies. Using a weighted overlay, stakeholders can use the same tools that the state does to identify areas with multiple overlapping opportunities or where tackling specific challenges can help meet California’s conservation, public access, and climate goals.
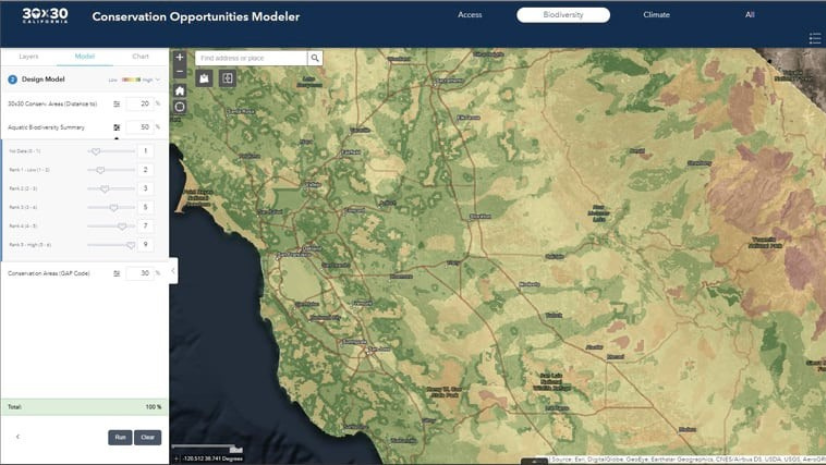
The Conservation Opportunities Modeler uses a technique called a Weighted Raster Overlay (WRO) to evaluate multiple factors simultaneously. Layers can be selected from within the available library, scores can be assigned to variables, and weights can be assigned to each layer.
Running the model, these are then combined to show the range of combined values across the landscape, whether high or low based on your assigned scores and weights. To learn more about web-based weighted raster overlay please visit Suitability Modeler.
More than Pathways—A Movement
The 30×30 effort is an emerging global movement, with leadership from across the world now focused on how to achieve this ambitious and essential goal. The integration of science and geographic data can be applied to advise on how to achieve the primary objectives of conserving biodiversity, tackling climate change, and ensuring that everyone can access the outdoors.
Wade Crowfoot, California’s Natural Resources secretary, said at the 2022 Esri User Conference, “It’s a remarkably unique time to be alive, because, as President [Barack] Obama said, we are the first generation to understand the impacts of climate change, and the last generation to do something about it.”
To learn more about California’s 30×30 Pathways, visit the CA Nature website.
To learn more about Esri conservation, view our webpage and sign up for newsletter updates.


