The Insights scripting environment can be used to access Python and R kernels through a Jupyter Kernel Gateway. This lesson will walk you through the fundamentals of using the scripting environment to complete a data engineering workflow.
The number of fatal cycling accidents in Ottawa, Canada, has been troubling cycling advocates for years. In the Get started with ArcGIS Insights lesson on Learn ArcGIS, you used Insights to analyze cycling accidents in Ottawa from 2015 to 2018.
The 2019 traffic collision data is now available on the Open Ottawa website. You will use the Insights scripting environment to update the dataset from the lesson with the 2019 data, and then rerun the analysis.
This workflow was last tested on July 24, 2023.
Before you begin
Insights in ArcGIS Enterprise and Insights desktop support connections to a Jupyter Kernel Gateway, which can be used to open a scripting environment and run scripts in Python and R. If you have access to Insights in ArcGIS Online, you can download Insights desktop and use it to access the Insights scripting environment. You can use your Insights in ArcGIS Online account to activate Insights desktop. Insights 2021.2 or later is recommended for this workflow.
You must also set up a Jupyter Kernel Gateway. Steps to set up a Jupyter Kernel Gateway can be found in the Insights Scripting Guide on GitHub. Additional information on scripting in Insights can be found in the help documentation.
Import a workbook package
You will start by importing a workbook package into ArcGIS Insights. If you already completed the Get started with ArcGIS Insights lesson, you can reopen your workbook and skip to the next section.
- Download the Ottawa_cycling_accidents.insightswbk file. The item is an Insights workbook package containing all the data and analysis from the Get started lesson.
- Locate the downloaded file on your computer. Most browsers download to your computer’s Downloads folder by default.
- Open Insights in ArcGIS Enterprise or launch Insights desktop.
If you are opening Insights desktop for the first time, you will be asked to activate your account. You can activate Insights desktop using an Insights in ArcGIS Enterprise account or Insights in ArcGIS Online account.
If this is your first time signing in to your Insights account, the Welcome to Insights window appears.
- If necessary, in the Welcome to Insights window, click Skip.
- Click the Workbooks tab.
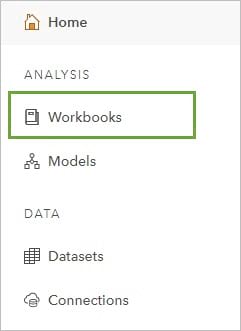
- Click Import and open the Ottawa_cycling_accidents.insightswbk file that you unzipped in step 2.
The workbook is loaded onto your Workbook page.
- Click the Ottawa cycling accidents workbook to open it. It may take a few minutes for the imported workbook to load the first time it is opened.
Add data and connect to your Jupyter Kernel Gateway
The 2019 traffic collision data is available to download from the Open Ottawa website. In this section, you will download the dataset, add it to your Insights workbook, and connect to your Jupyter Kernel Gateway.
- Follow the link to the Traffic Collision by Location 2019 dataset on Open Ottawa.
- Click the Download button. Under CSV, click Download.
- Return to Insights and click the Add to page button.

- Click the Upload file tab.
- Browse to the spreadsheet you downloaded and open it.
- Click Add.
The dataset is added to the data pane. Next, you will open the Insights scripting environment and connect to your Jupyter Kernel Gateway.
- Click the Scripting button to open the scripting environment.

- In the Kernel Gateway connection window, select your Kernel Gateway connection. If you have not already created a connection, click the Add new tab and enter the URL for your Jupyter Kernel Gateway. The web socket will be updated automatically using your URL.
- Click Connect.
The scripting environment opens. The script was written using Python, so you will select the Python kernel.
- Click Select Kernel and choose Python 3 from the menu.
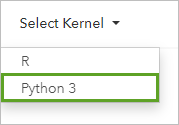
The scripting environment is now ready to start creating and running scripts.
Run Python code in the scripting environment
In this step, you will write and run code to append the 2019 traffic collision data to the Collisions dataset. You will be working with Pandas DataFrames, so you will start by importing Pandas.
- Click the first In[ ] cell and enter the code
import pandas as pd. Click the Run button or press Shift+Enter to run the cell.
The code in the cell runs. A new In[ ] cell is added to the scripting environment. Next you will create a DataFrame for the Collisions dataset.
- In the next In[ ] cell, enter the code
df1=pd.DataFrame(), but do not run the cell.
You will select fields from the Collisions dataset to use in the DataFrame.
- Expand the Collisions dataset in the data pane. Select the following fields: Year, TOTAL_COLL, Number of cyclists, PEDESTRIAN, X, and Y.
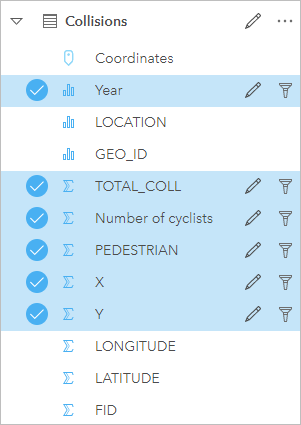
- Drag the selected fields to the scripting environment inside the brackets in the second cell.
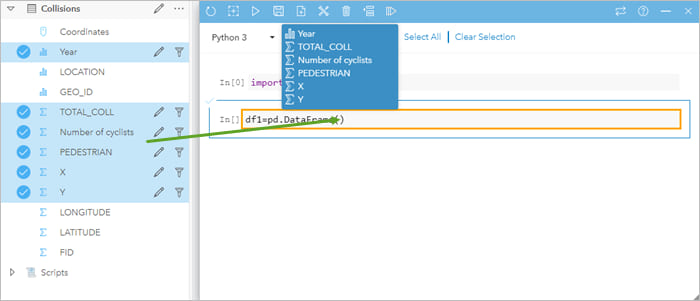
- Run the cell.
- In the next cell, create a DataFrame for the Traffic_Collision_by_Location_2019 dataset using the code
df2=pd.DataFrame()and the following fields: Total_Collisions, Cyclists_Collisions, Pedestrian_collisions, X, and Y. Run the cell.
You now have two DataFrames, one for each collision dataset. However, the 2019 data is missing a Year field. You will add a Year field to df2 in the first position so that it matches df1.
- In the next cell, enter and run the following code:
df2.insert(0, 'Year', 2019).
The code inserts a column named Year with a value of 2019 for each entry into position 0 (the first position on the left of the DataFrame).
Both DataFrames now include the same columns, but the column names do not match, which will cause issues if you try to append df2 to df1. You will rename the columns for both DataFrames.
-
- Enter and run the code
df1.columns=['Year', 'Total collisions', 'Number of cyclists', 'Number of pedestrians', 'X', 'Y']to rename all the columns in the df1 DataFrame. - Repeat the previous step, editing the code to rename the columns for df2.
- Enter and run the code
Click here for a hint to edit the code
Change df1 to df2 in the code, but keep the same column names.
Next, you will concatenate df1 and df2.
- In the next cell, enter the code
df1=pd.concat([df1, df2])and run the cell.
The 2019 data is appended to the 2015–2018 data. The df1 DataFrame now contains all the data from 2015 to 2019. You can now use df1 to create a new layer and add it to the data pane in Insights.
- Enter the code
%insights_return(df1)and run the cell.
A new dataset named Layer is added to the data pane. Your work in the Insights scripting environment is complete, so you will close it.
- In the scripting environment, click the close button, and click Yes, close on the warning dialog box.
In the next section, you will rerun the models in the workbook using the newly created dataset.
Update the workbook model
In Insights, a model recording the steps in your analysis is created automatically for each page in your workbook. In this section, you will update the models on both pages using the new dataset you created so that your analysis will reflect all the available data.
Your workbook includes two pages, and both pages will need to be updated with the Layer dataset. You will copy the dataset to the second page before you update the model on the current page.
- In the data pane, select Layer and drag it onto the Collisions by route type page.
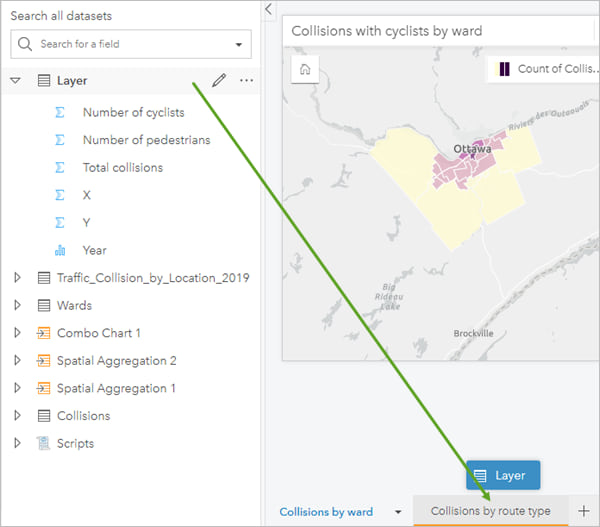
Layer is added to the data pane on the Collisions by route type page.
- Click Collisions by ward to return to the first page.
- On the workbook toolbar, click the Analysis view button.

The model in the analysis view shows the input datasets, followed by the steps in the analytical workflow and the resultant cards. You will update the input collision dataset.
- For the input dataset labeled Collisions, click Update.
- For Choose a dataset, expand the menu and choose Layer.
- For Replace fields, review each set of fields and verify that X, Y, and Number of cyclists are chosen as the replacement fields.
- Click Update.
- Click the Page view button to return to the cards.

The map and combo chart are updated with the new dataset. The two Traffic_Collision_by_Location datasets are no longer being used, so they can be removed from the workbook.
- For the first Collisions dataset, click the Dataset options button, and click Remove.
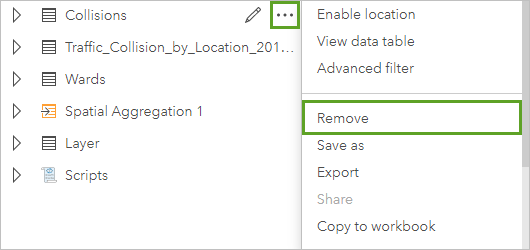
- Repeat the previous step for the second Traffic_Collision_by_Location dataset. Next, you will update the model on the second page.
- Click the Collisions by route type tab.
- Repeat the steps to update the model. Remember to verify that the correct replacement fields are being used. Return to the Page view to view the updated cards.
Your workbook is now updated to include collisions from 2019.


Article Discussion: