ArcGIS Business Analyst Web App is one of Esri’s premium applications dedicated to supporting data-driven decisions. Business Analyst Web App combines demographics, business, segmentation, and other data with maps and easy-to-use workflows to make geospatial data part of your business analysis.
This blog shares the latest enhancements in the September 2021 release for the following:
- ArcGIS Business Analyst Web App (Advanced and Standard)
- ArcGIS Business Analyst Mobile App
- ArcGIS Community Analyst
Highlights
Key enhancements include:
- New Dominant Tapestry Profile Infographic Template
- Projects panel category filter
- Custom text field in PDF export
- Data updates including New premium data by Mexico (INEGI), 10 new and 36 updated countries and regions from Michael Bauer International and others.
New Infographic Template in the U.S.
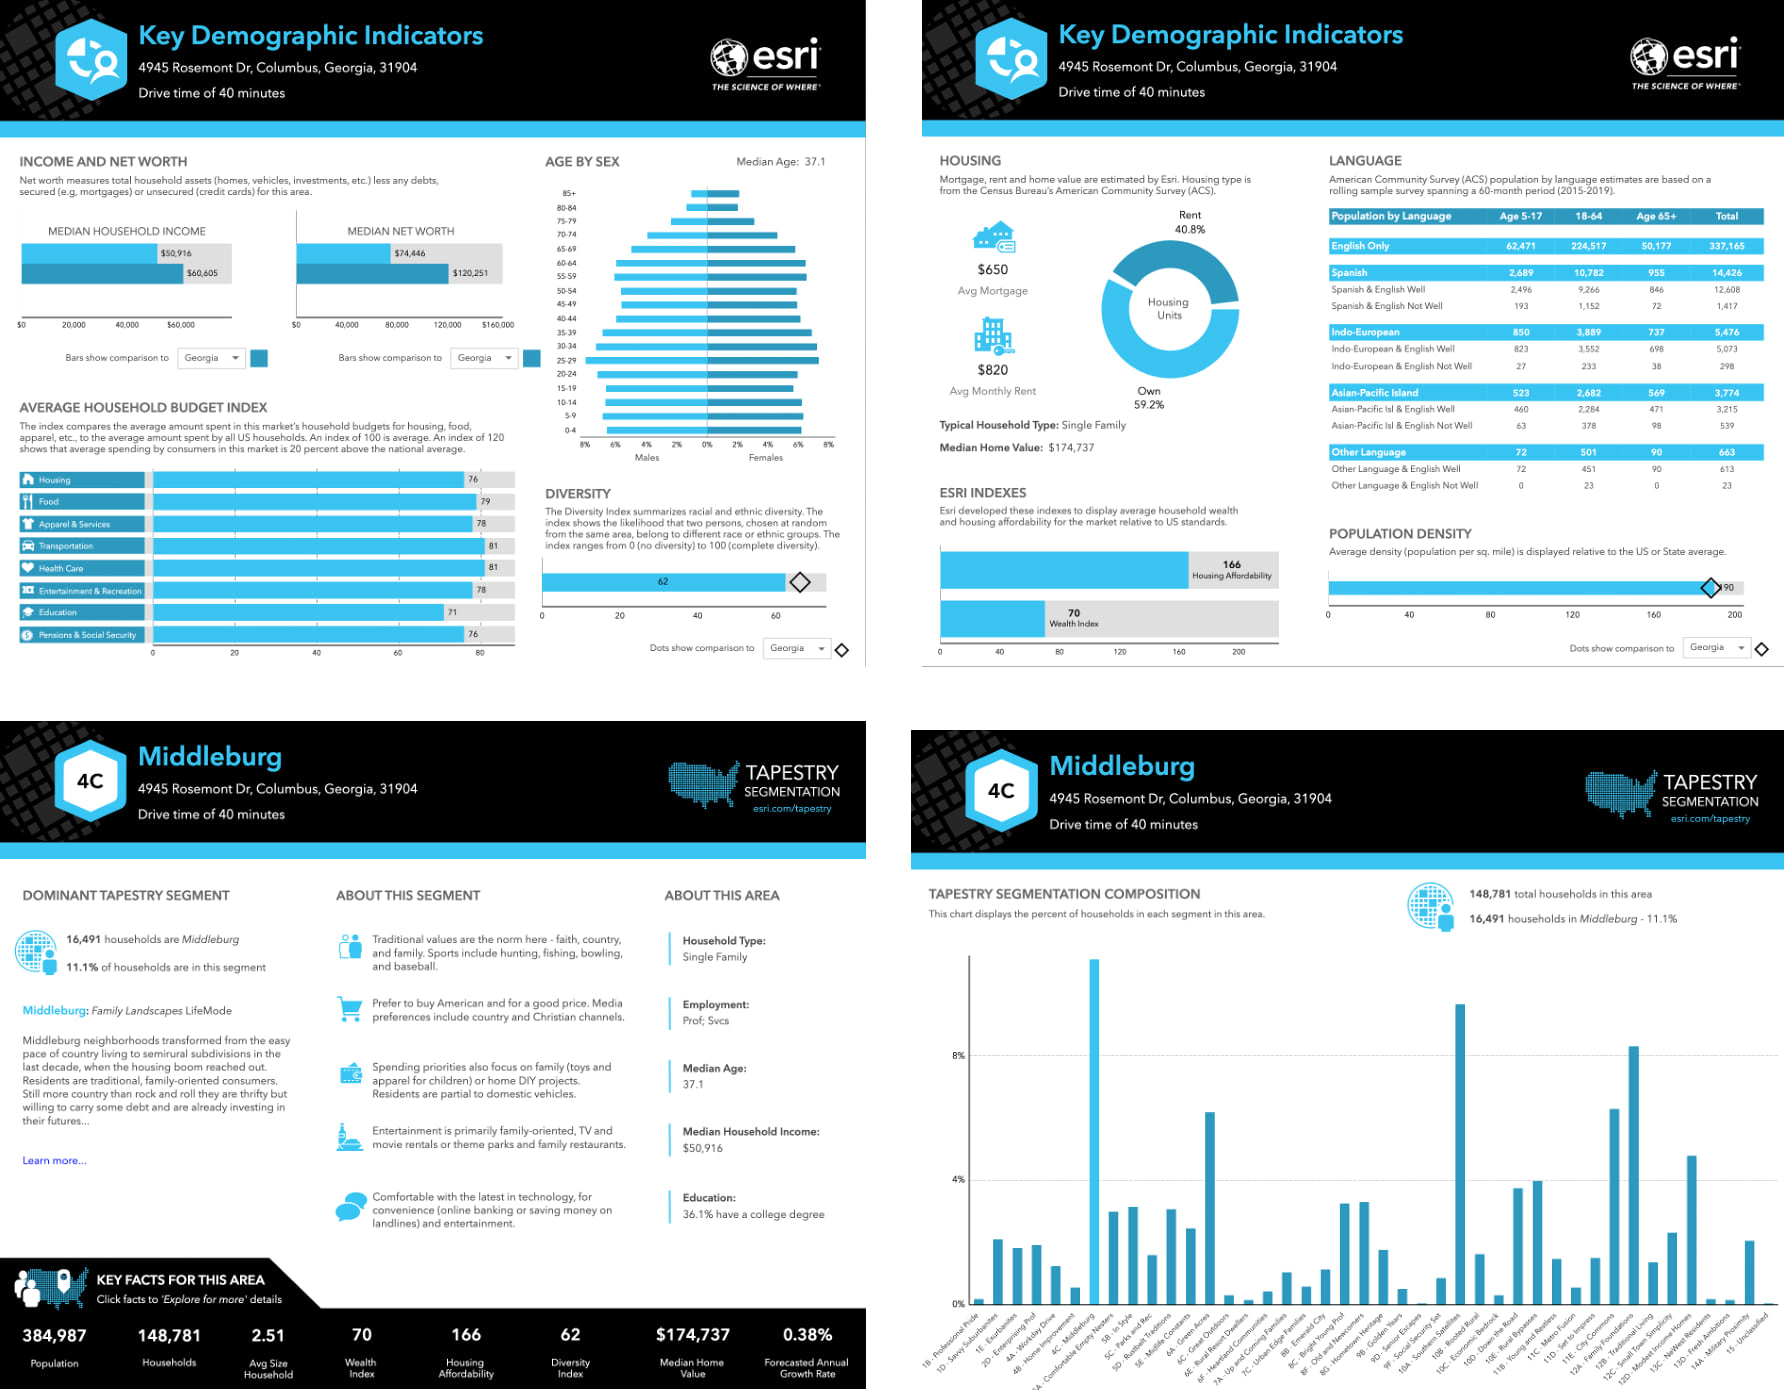
When analyzing within the U.S., you can employ a new infographic template, “Dominant Tapestry” to see key demographic indicators for the dominant Tapestry segment in the study area. This new infographic provides a detailed description of residents, their lifestyle choices, what they buy, and how they spend their free time.

Projects Panel Filter
Do you work with many layers and need to reduce visual clutter? With the September 2021 release, you can focus solely on the layers or categories you need in the Projects Panel by a new filter, collapse and expand feature.

Custom Text Fields
Ever need to add custom information to infographics as you share them with team members? You can find a new option to add a custom text field when creating a custom infographic template. When you run the infographic with text editing enabled, you can now add custom text before exporting the infographic to PDF. For example, the following screen shows how to enable the text editing panel in an infographic during an edit mode (on the left). The image on the right shows the exported PDF of the infographic with the custom text.

Data Enhancements
The ArcGIS Business Analyst team works closely with Esri’s Data and Location Services team. We are excited to announce the following data updates for ArcGIS Business Analyst Web, Mobile, ArcGIS Business Analyst Pro using Online data, and ArcGIS Community Analyst:
- The Business Analyst Michael Bauer Research: A total of ten new countries and regions have been added: Brunei, Cambodia, Iran, Maldives, Myanmar, Nepal, Fiji, Papua New Guinea, French Guiana, Guyana.
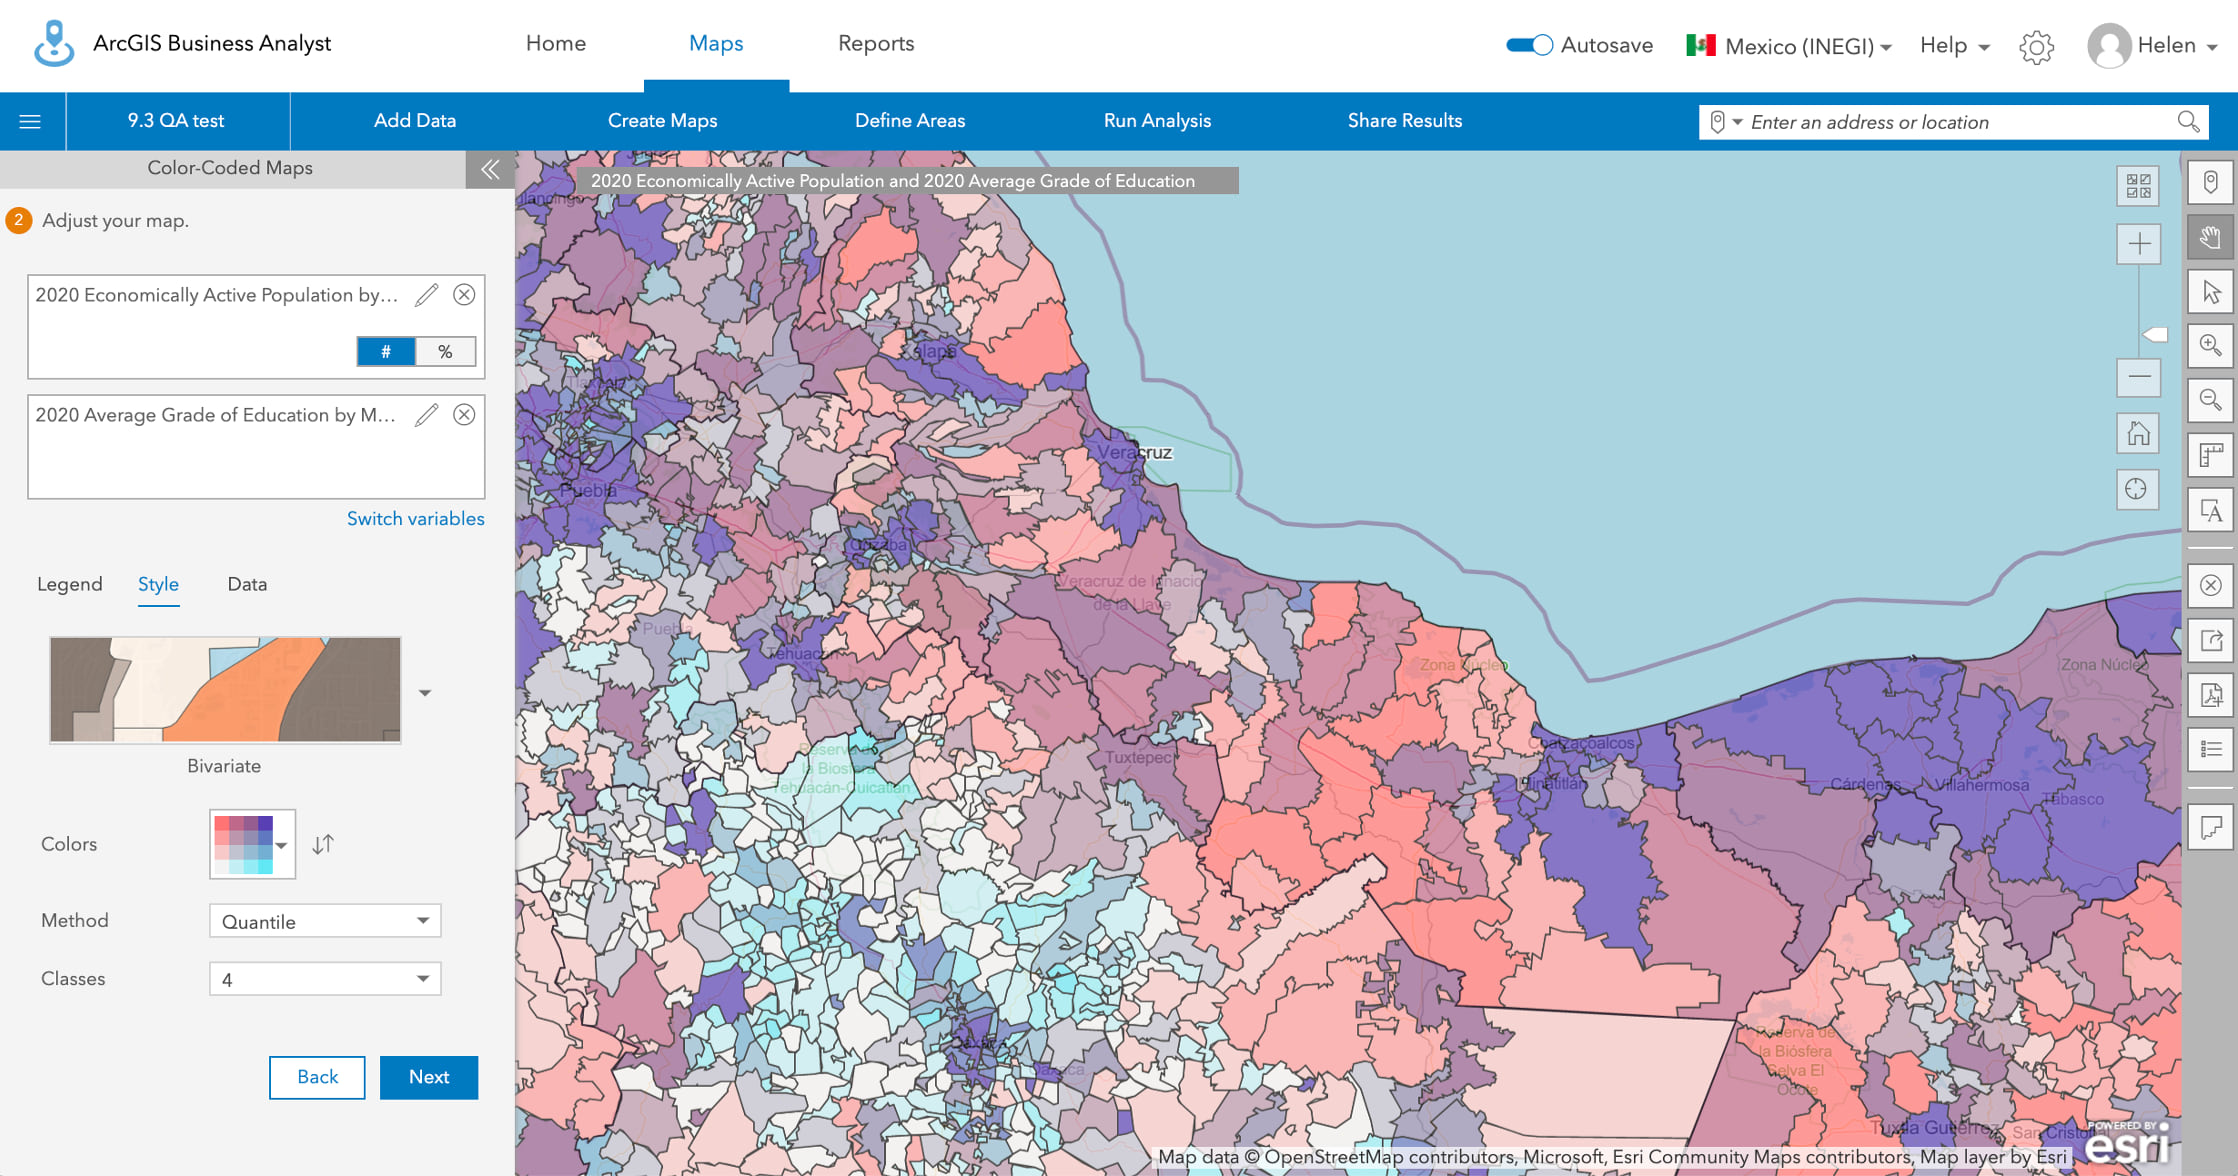
- New premium data in Mexico (INEGI). For the first time, we now support premium data in Mexico (INEGI). The INEGI data includes the latest Census 2020 data comprising 221 variables such as education, literacy, occupancy, health insurance coverage, and a Mexico Summary Report.

- Other ongoing data updates include:
-
- 36 European countries (Michael Bauer Research)
- Spain (AIS) data
- U.S. business locations and traffic points
-
Additional Resources
We hope you find the enhancements of the September 2021 release helpful. Additionally, please visit the following sites for more information on ArcGIS Business Analyst:
- Business Analyst product overview page
- Review pricing and purchase Business Analyst
- Business Analyst resources page
- LinkedIn user group
- Business Analyst YouTube playlist
- GeoNet community
- Business Analyst Web App login page
- Read the reviews of Business Analyst on G2
- Email the team: businessanalyst@esri.com


Article Discussion: