ArcGIS Online helps you understand the world around you by using interactive maps to connect people, locations, and data. You get smart, data-driven styles and intuitive analysis tools that deliver location intelligence. ArcGIS Online gives you the ability to make maps and apps to share your insights with your organization or the world. You can use it as a complete, cloud-based solution or to extend and complement the capabilities of ArcGIS Pro and ArcGIS Enterprise.
Don’t have an ArcGIS account? See Create an ArcGIS Account.
The November 2024 update includes new capabilities in Map Viewer, an Express mode for Experience Builder, new and updated Instant App templates, along with other enhancements and new functionality throughout ArcGIS Online. Highlights are provided below.
ArcGIS Online is updated three times each year. See the ArcGIS blogs to learn more about previous updates to ArcGIS Online and new functionality and enhancements you may have overlooked.
For more information and additional details about this release, see the What’s new help topic or view all posts related to this release.
Don’t have time to read the blog article? View the video below instead.
Quick links
Use the links below to jump to sections of interest.
-
Apps and App Builders
Map Viewer
Using Map Viewer, you can author, explore, edit, and share web maps. Administrators and members are encouraged to configure Map Viewer as their primary map viewer to take advantage of new capabilities and enhancements that are delivered with each update.
Here’s an overview of new features and enhancements to Map Viewer delivered in this update.
Multi tab view
To enable users to move quickly between workflows, Map Viewer now supports multiple tabs at the bottom of the map. Tabs are used to move quickly and easily between open tables, charts, models, and raster function templates, delivering the ability to move quickly between them and providing an improved workflow experience.
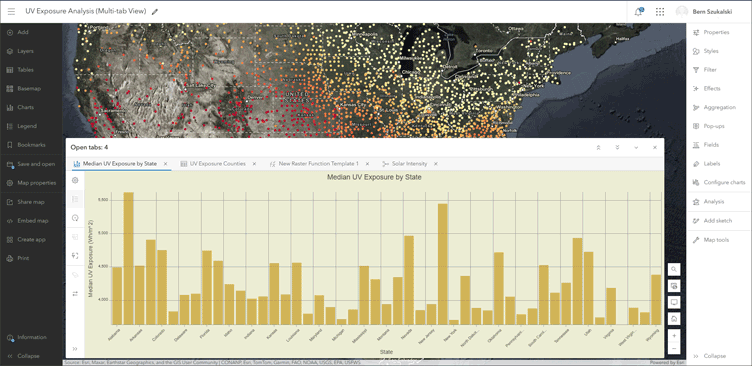
Tabs can be displayed at different heights, and can be minimized to have a full view of the map without needing to close them.
Embed maps
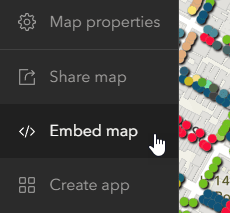
Map sharing is simplified using the new Embed map tool, found on the Contents (dark) toolbar. You can quickly customize the look and feel of the map by choosing light or dark modes, toggling map elements, and configuring actions. Copy the HTML that is generated to use in a web page, such as a blog or your organization’s website
Improved table functionality
In the Calculate Field window, you can now choose between Arcade and SQL to build field calculation expressions. Filters can be used to perform calculations on a subset of features. Fields and functions can be quickly inserted into expressions using the Arcade editor or the new SQL expression editor. Your calculation values can also be previewed before running the calculation, ensuring the desired results. Scripts can also be downloaded and saved for future use. For more information, see The new SQL field calculate experience.
Attachments can now be deleted, downloaded, updated, or viewed from within the table. You can also now add attachments using a familiar file browsing experience, or drag and drop supported files into the Attachment column.
Changes made to the field visibility, field order, and data sorting from within the attribute table in Map Viewer can now be saved to the web map or layer item. These configurations are visible when the attribute table is reopened.
Improved charts
Like maps, charts help uncover patterns, trends, and relationships in data. When used in conjunction with maps, charts can help you tell a more complete story with your data. The following improvements are introduced in this update:
- Bar charts and box plots now support a custom sort option so you can customize them to your preference. For example, you can arrange days in the week in a chart to their natural order.
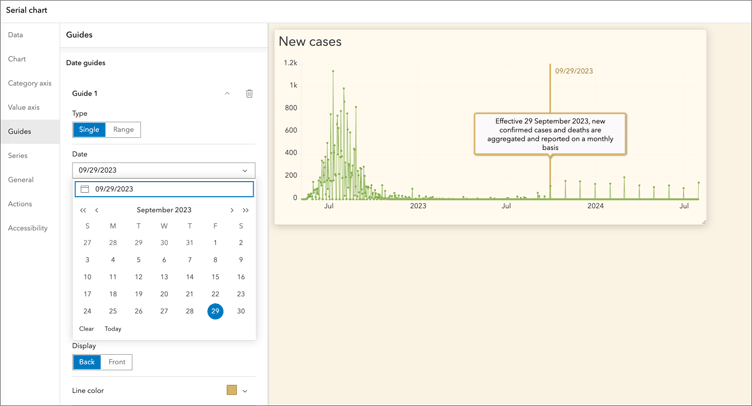
- Bar charts and line charts using date fields now support temporal axis guides for dates or date ranges, enabling you to bring attention to a specific date or range of dates in your chart.
- Bar charts can now be created using only numeric fields. The field name will be used as the categorical variable on the x-axis.
- Charts are now supported for subtype sublayers from subtype group layers. For more information on supported layers for charts, see Configure charts.
For more information, see What’s new in Map Viewer charts.
Sketch layer enhancements
You can add features to a map by creating a sketch layer. When you create a sketch layer, you add sketch features to symbolize something you want to show on the map. You can also add descriptive information that appears in pop-ups when sketch features are clicked. The features in a sketch layer are saved with the map and you can edit and update them at any time.
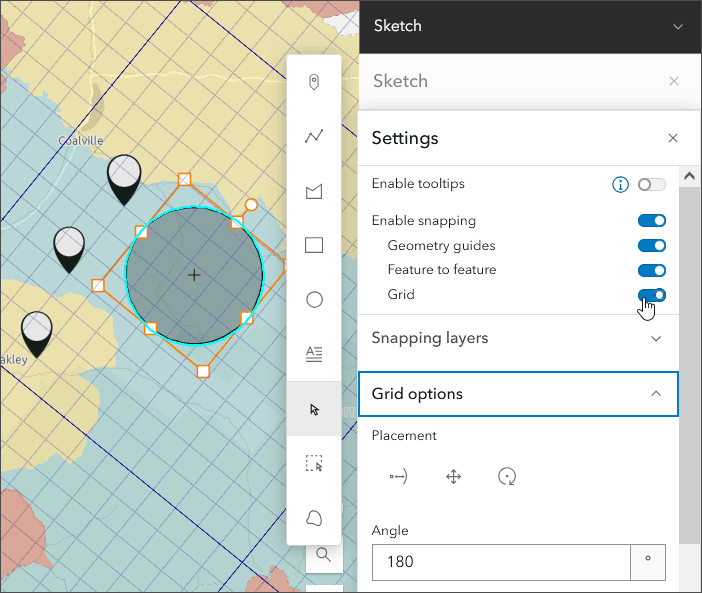
Sketch layer grid
When editing features and working with sketch layers, you can now display a customizable grid to help guide feature drawing and placement. The same grid capability is also available in ArcGIS Web Editor.
Custom sketch symbols
Web styles are collections of symbols stored in an item and are used to symbolize features. You can now customize your sketch symbol gallery by specifying a 2D sketch web style group in the organization settings.
CSS grid and flexbox support in pop-ups
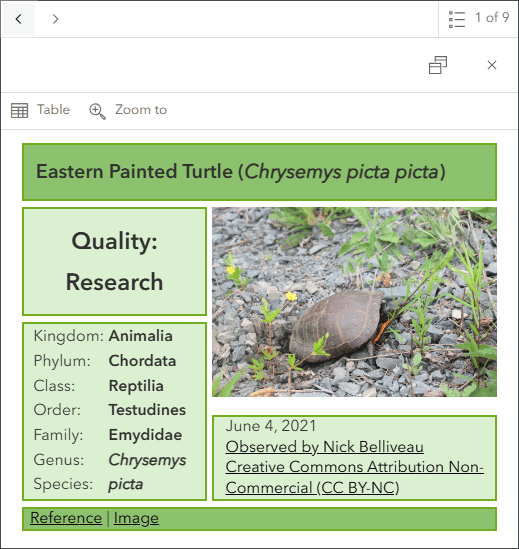
CSS grids and flexbox layouts allow you to format pop-up content using defined rows and columns into which attributes or calculated Arcade variables can be placed. CSS grids and flexbox provide additional flexibility when you need to create more complicated layouts.
Both can now be leveraged in returned text generated in Arcade elements, and can also be used within the Text element HTML editor.
Styles and symbols
Aggregation styles now support both lines and polygons in addition to points. Bins can be configured to display the density of features along with aggregated counts. The image below shows sinkhole polygons aggregated into rectangular bins when zoomed out; when zoomed in, the actual polygons are displayed.

Other improvements
When styling categorical data using the Types (unique symbols) style, you can now select all values in the Other category and move these values into a new or existing group.
When choosing a font for labels and text sketch features, the new Map fonts list shows fonts that are being used by layers in the web map that are provided by ArcGIS Online.
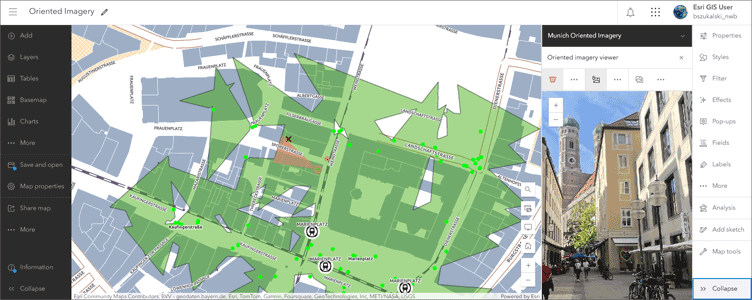
Oriented imagery layers
An oriented imagery layer is a type of feature layer for visualizing oriented imagery in the context of a map. Map Viewer supports viewing and managing oriented imagery layers using the oriented imagery viewer. When added to the map, each point in an oriented imagery layer indicates the camera location where an image was acquired. Improvements to oriented imagery layers in Map Viewer include the following:
- Oriented imagery layers can now be saved and duplicated.
- Users now have the option to project feature layers into their images in the oriented imagery viewer, improving interpretation of both their images and their vector data.
Other Map Viewer enhancements
Other enhancements to Map Viewer in this update include the following:
- Data fields can be sorted by the default sort order, display name, type, or field name from the Fields pane.
- You can now save exported map layouts and maps as items in My Content. If your organization has configured custom print layout templates (beta), you can now browse for custom print templates when printing a map layout.
- Users with the appropriate licensing can now configure an indoor positioning data service in Map Viewer.
Analysis in Map Viewer
Map Viewer’s spatial analysis tools allow you to quantify patterns and understand relationships in your data. Feature analysis and raster analysis tools and raster functions are available to all members with the appropriate privileges.
ModelBuilder (beta)
ModelBuilder (beta) is an interactive canvas for building analysis workflows using the analysis tools available in Map Viewer. Models are created by chaining together data and analysis tools into workflows, where the output of one tool becomes the input for another tool. These workflows can range from routine data management tasks to complex spatial analysis.
Models streamline your analysis by enabling iterative workflow runs, automating multistep processes, and documenting workflows that can be shared with others in your organization.
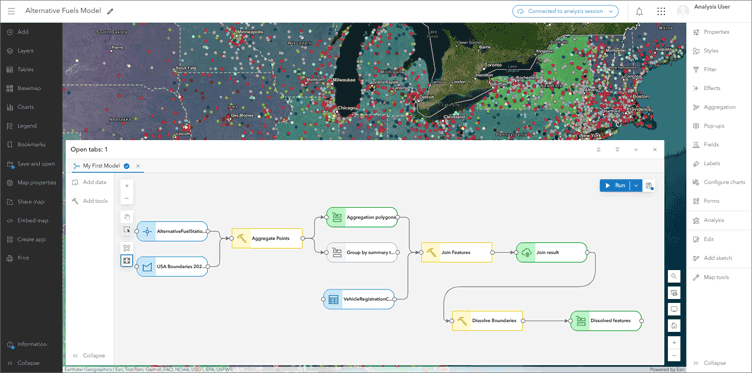
Tools used in ModelBuilder are displayed in a visual, step-by-step interface, making it easier to understand how the model is built and the analysis workflow. Output layers can be configured as temporary intermediate layers, or can be saved as hosted feature layers.
ModelBuilder will be available in beta to ArcGIS Online organizations that have beta capabilities enabled. For more information, see Introducing ModelBuilder in ArcGIS Online (beta). Visit the ModelBuilder Community and blog for the latest information, tips, questions, and community assistance.
New and updated analysis tools
Distance Accumulation and Distance Allocation raster functions have two new options for the Vertical factor parameter: Hiking time and Bidirectional hiking time. The performance of these tools has also been improved if the Distance method parameter value is Geodesic, or if the Vertical factor or Horizontal factor parameters are set.
The Raster Function Editor is a visual programming interface for building imagery and raster analysis function templates. The editor now supports multi-tab viewing, enabling you to switch between several raster function templates to make edits.
Two new raster function templates have been introduced:
- Monitoring Algae Bloom Concentration In Turbid Waterbodies uses the Normalized Difference Chlorophyll Index (NDCI) to monitor phytoplankton abundance in water.
- Create Cloud Free Image Composite with Landsat Level-2 is designed to create a cloud-free image composite using the Landsat Level-2 layer, which is accessible through the Living Atlas of the World.
The Geographic transformations environment setting is now available for raster tools and raster functions.
Custom web tools now support GPComposite and GPArealUnit parameter types. Note that these parameter types are not applicable for custom web tools published from ArcGIS Notebooks.
Scene Viewer
Scene Viewer is an interactive 3D web mapping and data visualization application for creating, exploring, and saving and sharing web scenes. With this update, Scene Viewer has been enhanced with new capabilities and features, including the following:
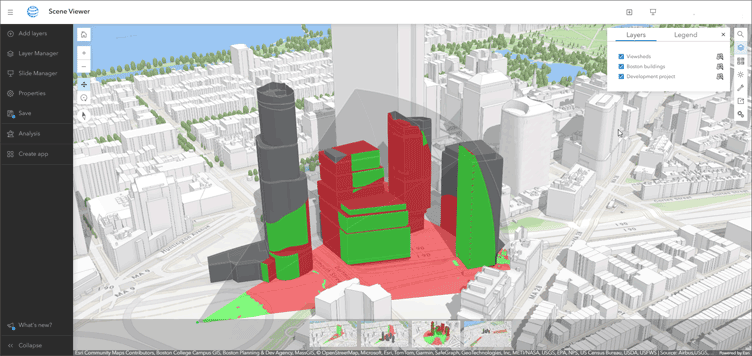
Viewshed layers
You can now quickly generate viewsheds to visualize line of sight within scenes. Viewsheds can be added by placing an observer location interactively, then adjusting the height, observer location, direction, and distance. Multiple viewsheds can be added as layers in your scene, then saved and shared with others.
Direct access to analysis tools
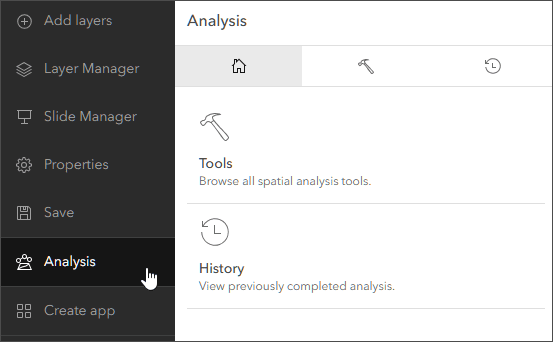
Spatial analysis tools and functions allow you to quantify patterns and relationships in the data and display the results. Using spatial analysis tools and functions, you can answer questions and make decisions using more than visual analysis alone.
Analysis tools are now available in Scene Viewer. Click Analysis on the Designer (dark) toolbar to display the Analysis pane and choose Tools.
Other changes and improvements
- You can create an empty 3D object scene layer that has an associated hosted feature layer but contains no data. After you create the layer, you can populate it by creating features in Scene Viewer or uploading 3D models. After the layer is populated, you can edit features or attributes in Scene Viewer or ArcGIS Pro.
- Administrators, or those with sufficient privileges, can specify a custom 3D basemap gallery and also a default 3D basemap for your organization to use in Scene Viewer.
- Scene Viewer now supports oriented imagery layers.
- Catalog layer properties are now supported, including visibility controls, making it easier to work with spatial data directly in ArcGIS Online.
For more information, see What’s New in Scene Viewer (November 2024).
Content management
Least privilege API keys and app tokens
In ArcGIS Online, Application Programming Interface (API) keys and app tokens allow an automated process such as a Python script to perform tasks requiring authentication. Users can now have increased confidence that automated processes can honor least minimum privileges and also automate routine administrative functions as needed. With the November 2024 update, a token author can configure the token’s scope to only the required permissions for the workflow, allowing users to follow “least privilege” best practices.
Simplified metadata overwrite
Metadata can be overwritten by uploading an XML file, but it can be cumbersome to maintain and share XML files for this purpose. To simplify the process, users can now overwrite existing metadata for an item using the metadata from another item using that item’s URL or item ID.
Other enhancements
- When you share a hosted feature layer with a shared update group, group members can update the layers using the contents of a file.
- You can define a schedule to rebuild a hosted vector tile layer’s cache.
- You can now overwrite a hosted feature layer using a service definition file.
ArcGIS Instant Apps
ArcGIS Instant Apps is the next generation of focused web mapping applications, featuring a streamlined experience that lets you build apps quickly and easily using express or full setup modes. All Instant Apps templates can be found on the searchable Instant Apps home page.
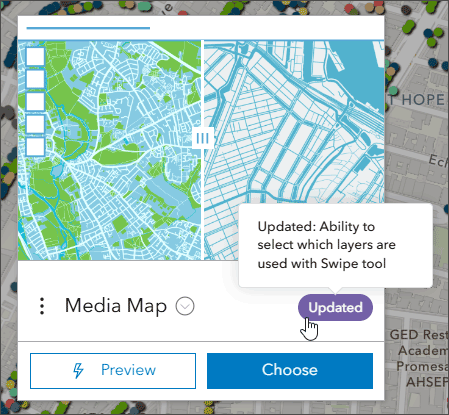
ArcGIS Instant Apps templates includes several new and updated app templates. Hover over the badges or cards to learn more about new, updated, or beta apps.
New in Instant Apps
The following Instant Apps were introduced in beta with the June 2024 update, and are now fully released.
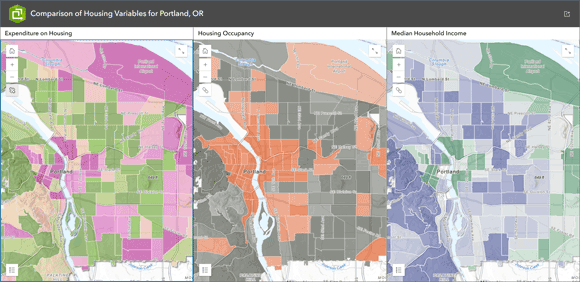
Compare allows viewers to compare multiple maps and scenes at the same location, or view multiple locations of the same map in a side-by-side, stacked, or quadrant layout. Choose up to four maps, scenes, or a combination of both to visualize at the same time. Map navigation can be synced throughout the views while using the app.
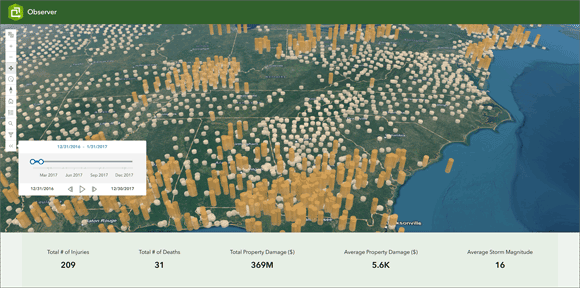
Observer is designed to provide users with the ability to explore scenes and learn more about the data, and includes time sliders to view change over time and attribute filters. You can configure a scoreboard that will return statistics about features in the current visible extent. The template can also be configured with an optional basemap gallery and daylight tool.
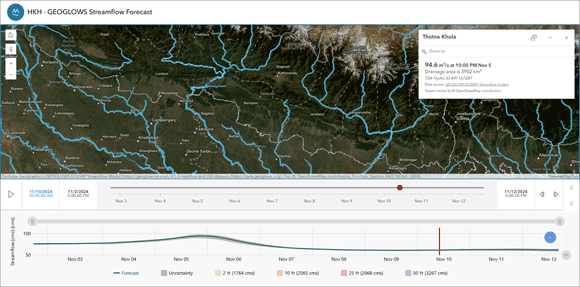
Streamflow Viewer delivers the ability to explore streamflow forecasts. This app includes built-in connections to two streamflow services: the GeoGloWS Streamflow forecast service,a 10-day river streamflow forecast from the European Centre for Medium-range Weather Forecasting (ECMWF), or the United States National Water Model, a 10-day river forecast from the National Weather Service. Both models are reported in 3-hour time intervals and are updated daily.
App viewers can interact with a graph, showing the return period flow for a specific stream segment. Changes can be animated in the forecast data for each stream segment using a time slider.
Instant Apps updates
Atlas enables organizations to highlight a collection of curated maps and layers. It’s an effective way to enable non-GIS users to make their own maps and explore your organization’s content. Atlas now includes a time slider for time-aware maps and allows for pop-ups to be added to sketched features.
Manager offers the ability to add multiple maps and review and modify editable layers. Editing tools enable users to edit attributes, attachments, and related records of features. Manager also includes a basic set of map exploration tools to help navigate the maps. Manager adds the capability to create new features and edit geometry of existing features, plus offers multiple layout options.
Media Map maximizes the potential of your map with map navigation tools, time animation, and swipe. Display and animate time enabled data to highlight changes over time. The swipe capability has been enhanced at this release; app authors can expose a swipe layer picker to allow app users to have more control over the swipe feature.
Public Notification allows viewers create a list of features that can be exported to a CSV or PDF file. Lists of features are created by searching for a single location, drawing an area of interest that includes features within, or using the geometry of an existing feature as the area of interest. Public Notification has enhanced its configurable list options, allowing app authors to set search distance for layer features.
Zone Lookup allows viewers to search for an address or use their current location to identify locations that are within a zone or region. Group results by layer to provide app viewers with an organized view of their search results. Zone Lookup has added the ability to generate statistics based on the searched area.
3D Viewer offers 3D navigation tools for viewers to interact with scenes. You can optionally include a Locator map and slides to provide context. Line-of-sight, measure, and slice tools can be enabled to allow viewers to interpret 3D data in the scene. 3D Viewer added two new capabilities at this update: viewshed analysis and the oriented imagery tool.
For more information, see What’s new in Instant Apps.
ArcGIS Experience Builder
Use ArcGIS Experience Builder to build modern mapcentric or non-mapcentric web apps and webpages without writing code. Start building from scratch or choose from an extensive library of templates that you can customize.
You can add functionality to any template with widgets you can drag, drop, and configure. You can also add custom widgets, themes, and actions with low-code development to further extend your web app.
Express mode
Experience Builder introduces a new Express mode, offering a quick and simplified app building workflow. Choose from a variety of templates (similar to those in Web AppBuilder) to begin creating a new app, then follow the streamlined workflow to complete your experience. You can add and configure additional widgets in each layout, select different themes, and preview layouts in desktop and mobile views prior to publishing.
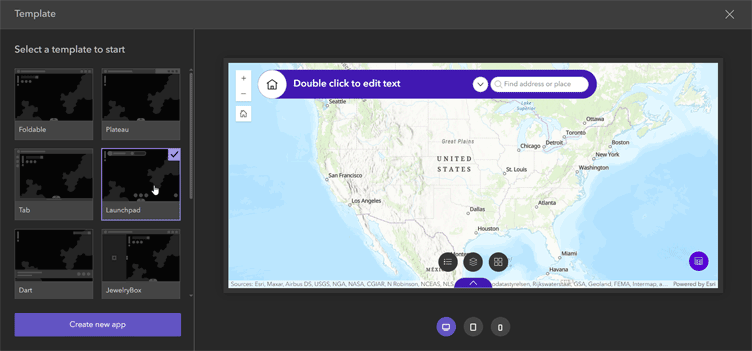
Express mode is the perfect transition for those still using ArcGIS Web AppBuilder, which is scheduled for retirement in 2026. Express mode enables users to build an app with a single map, similar to Web AppBuilder workflows, and includes all of the Web AppBuilder classic templates such as Foldable, Billboard, Launchpad, and more. For more information, see ArcGIS Experience Builder: Introducing Express mode.
New Templates
There are four new templates available with this update. New templates can be identified by the New badge, which appears on the template thumbnail in the Templates Gallery. Hover over the card for more information.
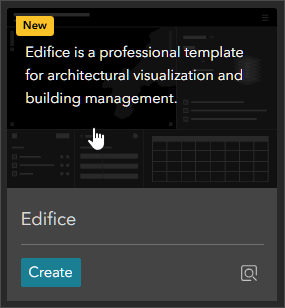
New templates are as follows:
- Edifice is a professional template for architectural visualization and building management.
- Recap features a clean and crisp design that applies focus to the content. Images and text are organized into blocks separated by whitespace for clear topic divisions.
- Skyline is a sleek template designed for showcasing professional services. It features distinct sections with a prominent map display, circular graphics, and a gallery-like bookmark.
- Vista is a comprehensive two-page template designed for in-depth building exploration.
Other enhancements
Other enhancements in this release include the following:
- A new Accordion widget is added. The widget is a layout container that can be used to organize other widgets into a vertically stacked menu with expand and collapse buttons.
- A text tool has been added to the Draw widget
- Custom filters can now be set at run time with the Filter widget and subtype group layers are now supported.
For more information, see What’s new in Experience Builder.
ArcGIS Dashboards
ArcGIS Dashboards enables users to convey information by presenting location-based analytics using intuitive and interactive data visualizations. Dashboards are used to help make decisions, visualize trends, monitor status in real time, and inform their communities.
With this update, ArcGIS Dashboards includes several new capabilities and enhancements. Highlights are as follows:
Chart axis guides
Serial charts have been enhanced to enable setting up axis guides to represent a single date or a shaded area that represents a range of dates.
Font support
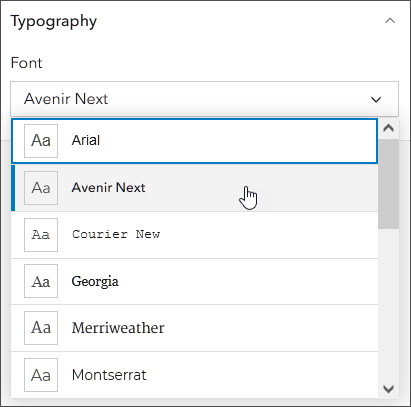
Dashboard authors can now select different fonts along with other options in a custom theme to enhance their dashboard. To create a custom theme, select an existing theme to customize it. Select a new font from the Font drop-down menu in the Typography section.
Measure tools in map elements
A Measure tool has been added to the map element, providing the ability to measure line distances or areas in maps or scenes. Display units of measure are set by the organization defaults.
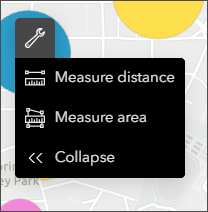
For more information, see What’s new in ArcGIS Dashboards (November 2024).
ArcGIS Data Pipelines
ArcGIS Data Pipelines streamlines data integration in ArcGIS Online, offering a drag-and-drop visual diagramming interface for creating data integration workflows. You can connect to data where it’s stored, perform batch processing, clean and transform the data, and then write the processed results out to a hosted feature layer, ready for use across the ArcGIS system. Data pipelines can be run interactively or on a recurring schedule, helping you to ensure that data is kept up to date even when the source data is changing.
With this update, ArcGIS Data Pipelines users can create data pipeline and data store items from My Content, then use them to build data integration workflows in the Data Pipelines app. Click New item, then choose Data pipeline.

Introducing Notes
Use notes to document your workflow or share context with collaborators. You can add notes to the data pipeline to document its purpose or usage, or you can add notes to specific elements of the data pipeline to outline information such as details about the source data, how or why certain tool parameters are used, or what the output feature layer can be used for.
Dissolve and Pivot tools
Two new data engineering tools have been added, Dissolve and Pivot, providing new options for batch processing when building datasets for use in ArcGIS Online. Dissolve enables users to combine polygon or polyline geometries that intersect, while Pivot allows users to convert a long dataset (many rows) to a wide dataset (many fields) by using values from an existing field to create new fields.
Remove boundaries and aggregate features with the Dissolve tool
The new Dissolve tool in ArcGIS Data Pipelines allows you to combine polygon or polyline geometries that intersect, have the same value for a specified field, or a combination of both.
Identify patterns with the Pivot tool
You can summarize data to identify patterns by comparing attributes and flattening one-to-many relationships using the Pivot tool in ArcGIS Data Pipelines.
For more information, see What’s new in ArcGIS Data Pipelines (November 2024).
ArcGIS Notebooks
ArcGIS Notebooks provides a Jupyter notebook experience optimized for ArcGIS, allowing users to combine sophisticated spatial algorithms with powerful open-source Python libraries to develop advanced spatial data science models. ArcGIS Notebooks reduce time spent managing dependencies across data science ecosystems and increase cross-team collaboration and transparency. Updates for Notebooks include:
New versions of ArcGIS API for Python, ArcPy, and Python libraries are now available in the notebook runtimes.
Notebook authors with publish web tools privileges can now configure input parameters that are optional or have a choice list for notebook web tools. Additionally, you can now copy over the parameters of a notebook when saving it as a new notebook.
ArcGIS Web Editor
ArcGIS Web Editor is a new web-based editing app that provides a focused, efficient editing experience in ArcGIS Online. Web Editor combines tools you’re already familiar with such as snapping, templates, and forms, with new capabilities.
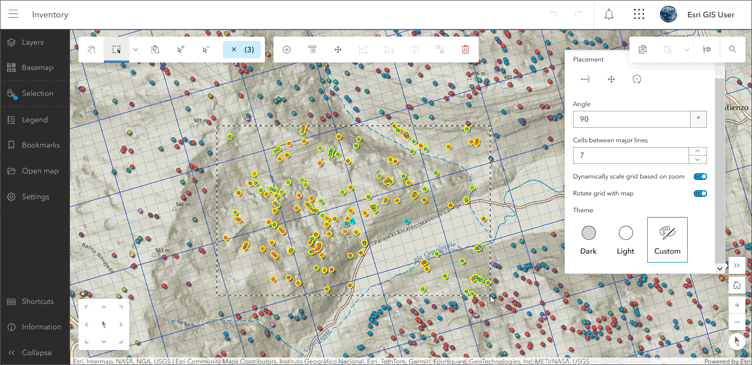
The November update includes enhancements and new functionality, highlights include the following:
- Grid settings are now available to create and customize an overlay grid for your web map. The grid helps you align features and visualize distances as you modify or create features. When snapping is enabled, the pointer snaps to grid line edges and intersections.
- URL parameters are now supported for Web Editor. URL parameters can be used to modify and share a web map in Web Editor.
- Pop-up configurations from Map Viewer are now shown in Web Editor when the pop-up is viewed for a selected feature.
- You can now set measurement units in Web Editor to either US Standard or Metric in the Settings pane.
For more information, see What’s new in ArcGIS Web Editor (November 2024).
ArcGIS Living Atlas
Find ready-to-use, trusted content from the GIS community in the form of layers, maps, apps, tools, and 3D scenes. Easily access this collection of content to quickly kickstart your ArcGIS Online workflows, saving you time and effort.
Living Atlas content is published and updated regularly. For the latest news and information, see the ArcGIS Living Atlas home and the ArcGIS Living Atlas blogs. The following are highlights of new spatial content available within Living Atlas.
ArcGIS Living Atlas Content
US Regrid Parcels
Made available in collaboration with Esri’s partner Regrid, users can access this new parcel layer directly through Living Atlas. This layer will be regularly updated and covers urban, suburban, and rural areas in the United States, providing a complete view of land parcels. Premium detailed parcel information can be downloaded from links in the layer pop-up.
2050 Projections of World Terrestrial Ecosystems
Quickly access a set of global layers at 1 km resolution for projections of terrestrial ecosystems in 2050, and compare them to today’s ecosystems to learn what could change.
Highway Performance Monitoring System
The Federal Highway Administration (FHWA) is responsible for assuring that adequate highway transportation data and systems performance information is available via the Highway Performance Monitoring System (HPMS) program. The Highway Performance Monitoring System layer contains all states’ highway segments in one feature layer, and are pre-configured with thoughtful symbology and informative pop-ups.
FCC Broadband Data Collection
The December 2023 Broadband Data Collection (BDC) is now available within ArcGIS Living Atlas. This ready-to-use layer shows fixed broadband availability for every Census Block and H3 Resolution-8 hexagonal area in the U.S. and outlying territories. The layer summarizes the December 2023 BDC data showing the number of served, underserved, and unserved Broadband Serviceable Locations (BSLs) by transmission technology in a given geography.
County Health Rankings
A dataset often used to understand communities is the County Health Rankings & Roadmaps Annual Data Release. The 2024 feature layer is now available, sourced by the County Health Rankings & Roadmaps (CHR&R), a program of the University of Wisconsin Population Health Institute with support from the Robert Wood Johnson Foundation.
Global Wildland-Urban Interface
If you have ever wondered how close you live to areas prone to wildfire, or have wondered why anyone would want to build a housing community near wildfire-prone areas, you can begin to explore the answers using the Global Wildland-Urban Interface (WUI) layer.
ArcGIS Living Atlas Apps
Landsat Explorer
Since 1972, Landsat satellites have continuously acquired space-based images of the Earth’s land surface as part of the U.S. Geological Survey (USGS) National Land Imaging (NLI) Program. This imagery provides uninterrupted data to help land managers and policymakers make informed decisions about our natural resources and the environment. Use the Landsat Explorer to investigate and unlock the wealth of information that Landsat provides.
Sentinel-1 Explorer
Sentinel-1 is a European radar imaging satellite mission developed by the European Space Agency (ESA) Copernicus program. It is designed to provide continuous all-weather, day-and-night, radar imaging for a variety of services, including monitoring sea ice, maritime surveillance, disaster management, and land monitoring. Use the Sentinel-1 Explorer to view the latest mosaicked imagery, find a scene by date, compare scenes, animate multiple scenes, detect change over time, and more.
More information
For more information and additional details about this update, see the What’s new help topic or view all posts related to this release. You can also watch an introductory video to see new capabilities in action. You can also watch an introductory video to see new capabilities in action.
Visit the ArcGIS Online Esri Community to ask questions, view blogs, learn from peers, and submit your ideas for future enhancements.


Commenting is not enabled for this article.