ArcGIS Online helps you understand the world around you by using interactive maps to connect people, locations, and data. You get smart, data-driven styles and intuitive analysis tools that deliver location intelligence. ArcGIS Online gives you the ability to make maps and apps to share your insights with your organization or the world. You can use it as a complete, cloud-based solution or to extend and complement the capabilities of ArcGIS Pro and ArcGIS Enterprise.
Don’t have an ArcGIS account? See Create an ArcGIS Account.
The February 2025 update includes new capabilities in Map Viewer, bulk attribute editing in ArcGIS Web Editor, the Building Explorer tool in Scene Viewer, an updated ArcGIS Instant Apps home page, along with other enhancements and new functionality throughout ArcGIS Online. Highlights are provided below.
ArcGIS Online is updated three times each year. See the ArcGIS blogs to learn more about previous updates to ArcGIS Online and new functionality and enhancements you may have overlooked.
For more information and additional details about this release, see the What’s new help topic or view all posts related to this release.
Don’t have time to read the blog article? View the video below instead.
Quick links
Use the links below to jump to sections of interest.
-
Apps and App Builders
- ArcGIS Instant Apps
- ArcGIS Experience Builder
- ArcGIS Dashboards
- ArcGIS Data Pipelines
- ArcGIS Velocity
- ArcGIS Notebooks
- ArcGIS Web Editor
Ready-to-use content
Map Viewer
Using Map Viewer, you can author, explore, edit, and share web maps. Map Viewer includes two vertical toolbars—the Contents (dark) toolbar on the left and the Settings (light) toolbar on the right. Use the Contents toolbar to manage and view the map contents and work with the map. Use the Settings toolbar to access options for configuring and interacting with map layers and other map components.
Here’s an overview of new features and enhancements to Map Viewer delivered in this update.
Animated symbols
When styling symbols, you can now configure additional animation properties depending on the symbol type, including color transition, rotation, scale factor, size and transparency. These can be used to apply focus to specific points of interest with animated symbols that move on the map. For example, a map of air quality monitoring stations might use an animated circle symbol to draw the readers’ attention to places with the highest PM2.5 measures.

Improved pop-ups for multidimensional imagery layers
Multidimensional imagery layers contain various variables across time or other dimensions. You can now access variable and dimension information for a multidimensional imagery layer when configuring pop-ups. These fields include variable name and dimensions such as time and depth.
Attachment display in pop-up
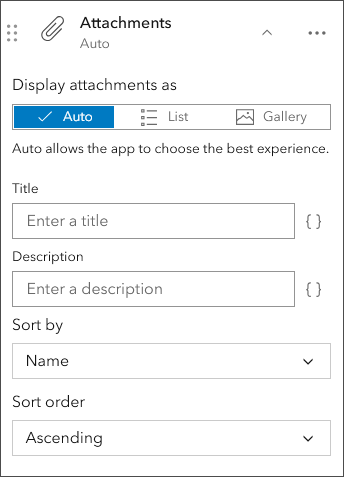
If a feature layer contains attachments, you can now choose how the attachments are sorted and displayed in the pop-up. In the pop-up Attachments pane, select the Sort by field and the Sort order (ascending or descending).
Zoom to imagery resolution
You can now select imagery layers (including WCS imagery layers) and zoom to their source resolution, ensuring you’re viewing raster data in its optimal resolution.
Create, manage, and update feature templates
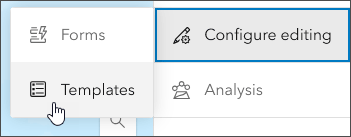
You can now create, manage, and update feature templates for hosted feature layers directly in Map Viewer if you are the layer owner or an administrator. Feature templates define categories of items that editors are allowed to add to a feature layer and are based on specific combinations of attributes. Previously, working with feature templates was only supported in Map Viewer Classic or Field Maps Designer, requiring switching between apps. Templates can be managed in Map Viewer by choosing Configure editing from the Settings (light) toolbar, then choosing Templates.
Oriented imagery viewer measurements
When working with the oriented imagery viewer, you can now perform ground-related measurement within an area of interest. Measurements you can perform include ground distance, ground area, height above ground, and ground location.
Editing
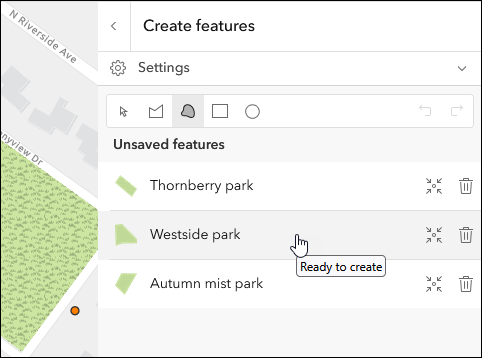
The editor now supports different drawing tools when creating polygon and line features. Choose from the new freehand, rectangle, and circle drawing tools to make sketching even easier. Additionally, you can explore pending edits when creating features in batch. Zoom to, edit, or delete a feature from the main list by clicking the “back” button after finishing a geometry.
ArcGIS Pro display filters
Web maps can honor display filters created in ArcGIS Pro. Display filters are queries that limit which features of a layer are displayed while still providing access to all the data. They can be determined by scale or set manually. Display filters can help improve performance with large datasets and increase the focus of the map by showing specific features at each scale. For example, users can set a display filter on a detailed hydrology dataset that shows major rivers at small scales and more detailed, smaller rivers as viewers zoom in to larger scales.
Analysis in Map Viewer
Map Viewer’s spatial analysis tools allow you to quantify patterns and understand relationships in your data. Feature analysis and raster analysis tools and raster functions are available to all members with the appropriate privileges.
ArcGIS Living Atlas imagery optimized for analysis
Select ArcGIS Living Atlas of the World imagery layers can now be optimized for raster analysis. Currently, Landsat Level-2, Sentinel-1 RTC, Sentinel-2 Level 2A, and NAIP imagery layers are supported. This feature is currently in beta, and is turned off by default.
New and updated analysis tools
Subtype sublayers from subtype group layers are now supported when running an analysis tool from the tool pane. Note that these are not yet supported in ModelBuilder (beta). For more information, see supported data.
The new Tabulate Area raster analysis tool calculates the cross-tabulated areas between two datasets and reports the results as a table.
The new Zonal Geometry as Table raster analysis tool calculates geometry measures for each zone in a dataset and reports the results as a table.
For more information, see What’s new in imagery in ArcGIS Online (February 2025).
ModelBuilder (beta)
ModelBuilder (beta) is an interactive canvas for building analysis workflows using the analysis tools available in Map Viewer. Models are created by chaining together data and analysis tools into workflows, where the output of one tool becomes the input for another tool. These workflows can range from routine data management tasks to complex spatial analysis.
Models streamline your analysis by letting you run workflows repeatedly, automate multi-step processes, and document your methods for easy sharing within your organization.
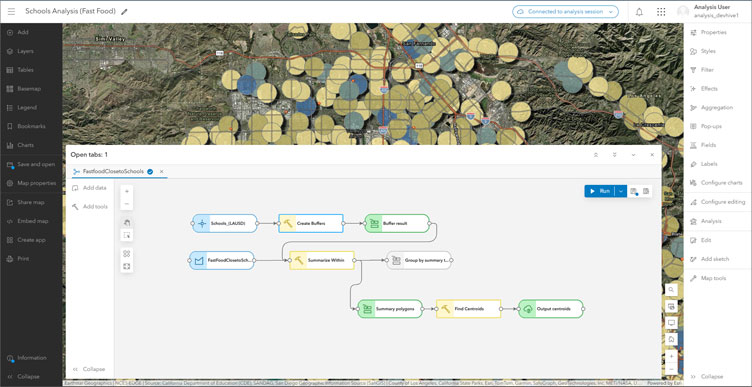
Tools used in ModelBuilder are displayed in a visual, step-by-step interface, making it easier to understand how the model is built and the analysis workflow. Output layers can be configured as temporary intermediate layers, or can be saved as hosted feature layers.
ModelBuilder (beta) is available to ArcGIS Online organizations that have beta capabilities enabled. For more information, see Introducing ModelBuilder in ArcGIS Online (beta). Visit the ModelBuilder Community and blog for the latest information, tips, questions, and community assistance.
ModelBuilder (beta) now supports sharing analysis model items to groups, your ArcGIS organization, and the public. Model Builder (beta) now includes Enrich Layer and Generate Travel Areas.
For more information, see What’s new in ModelBuilder Beta (February 2025).
Scene Viewer
Scene Viewer is an interactive 3D web mapping and data visualization application for creating, exploring, and saving and sharing web scenes. With this update, Scene Viewer has been enhanced with new capabilities and features, including the following.
View multiple Building Scene Layers (BSL)
This new feature in Scene Viewer allows users to view detailed models of multiple BSLs at once, enhancing use cases like asset management and construction site inspections. This improvement facilitates better comparison and analysis, supporting more effective planning and decision-making, for users that are creating Digital Twins. For more information, see Explore building scene layers.
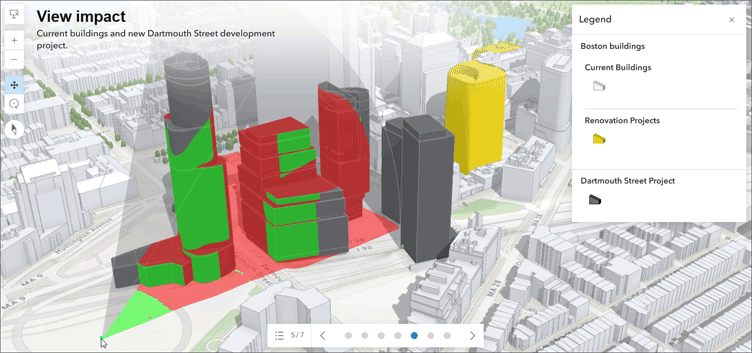
Slide captions and legends
Enhance 3D presentations with Slide Manager. You can now add slide captions and automatically display legends while moving through a scene.
Other improvements
- Scene Viewer provides a new and simplified phone user experience that supports 3D presentation capabilities.
- Feature and scene layers can be duplicated to efficiently copy layer styles and properties.
- Voxel layers now support pop-up configurations.
- Scene Viewer now supports the OGC Web Coverage Service (WCS) layer type.
- Editing workflows have been enhanced with improved batch editing and drawing tools.
For more information, see What’s new in Scene Viewer.
Content and organization management
Inserting attachments from a file geodatabase
When you add features to a hosted feature layer from a file geodatabase, you now have the option of inserting the associated attachments along with the new features.
OGC Web Coverage Service (WCS) layers
ArcGIS Online now supports Open Geospatial Consortium (OGC) Web Coverage Service (WCS) layers. You can add them as an item using their URL and also use the URL to add them in Map Viewer and Scene Viewer.
Member content transfer improvements
You can transfer content owned by one or more organization members to another member of your organization. This is typically done when deleting members and needing to keep their content available to the organization, but can also be done when needing to assign content to another member for curation or maintenance. During that process, you can now maintain the folder structure when transferring content from one member to another.
ArcGIS Instant Apps
ArcGIS Instant Apps are lightweight, configurable web applications that allow users to quickly create and share interactive maps and apps without the need for extensive coding or development skills. The templates feature a streamlined experience that lets you build apps quickly and easily using express or full setup modes. All Instant Apps templates can be found on the searchable Instant Apps home page.
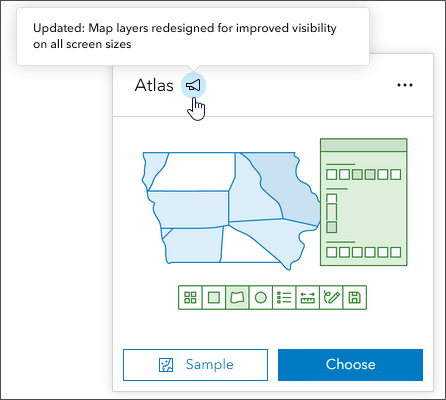
ArcGIS Instant Apps templates are regularly updated. On the Instant Apps home page, look for and hover over the announcement badge or card to learn more about any new, updated, or beta apps.
Refreshed Instant Apps home page
When you open the Instant Apps home page, you can browse a gallery of app templates and choose one as a starting point for creating an app. The home page includes details about each template, including data requirements and search capabilities to help you choose the right app.
With this update, the home page has been refreshed with an improved look and feel. App template cards have been streamlined to provide quick access to viewing samples, the app description, and item details.
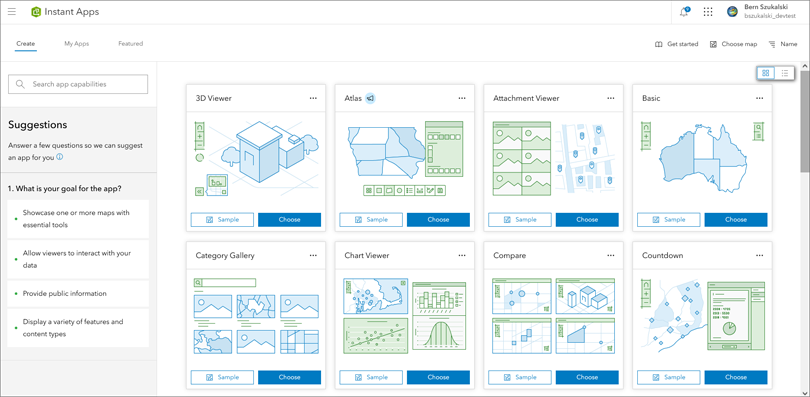
Search has also been incorporated into the side pane, making apps easier to find by searching for capabilities using keywords. You can also view the capabilities matrix, which provides a comprehensive view of available tools and capabilities for all Instant Apps.
Instant Apps updates
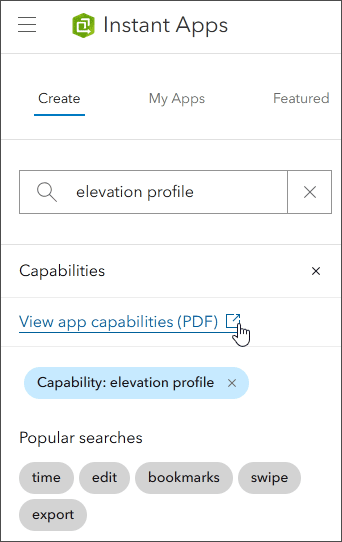
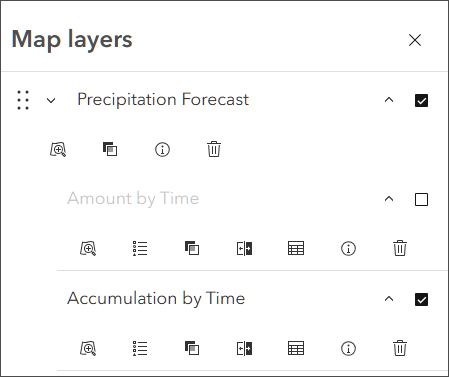
Atlas enables organizations to highlight a collection of curated maps and layers. It’s an effective way to enable non-GIS users to make their own maps and explore your organization’s content. Users can easily discover and use content, as well as share the maps they create via PDF or screenshots, or after signing in can save the map. Built-in tools help users explore the map by searching locations, switching between 2D and 3D, measuring distance and area, and using sketch tools to add text and arrows to the map.
Atlas has been updated with new button styles to support small screens and lower resolution devices as well improved help information and improved collapse and expand options for group layers.
For more information, see What’s new in Instant Apps (February 2025).
ArcGIS Experience Builder
Use ArcGIS Experience Builder to build modern mapcentric or non-mapcentric web apps and webpages without writing code. Start building from scratch or choose from an extensive library of templates that you can customize. Use the recently introduced Express mode for a quick and simplified app building workflow.
You can add functionality to any template with widgets you can drag, drop, and configure. You can also add custom widgets, themes, and actions with low-code development to further extend your web app.
New Oriented Imagery Viewer widget
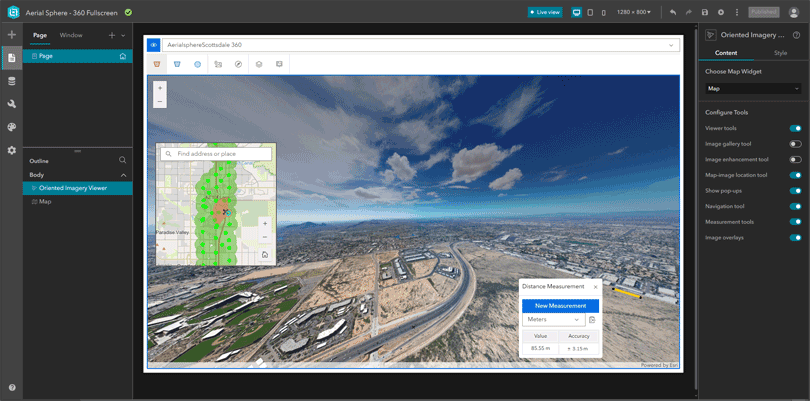
The new Oriented Imagery Viewer widget enables users to create web apps that locate and display oriented images, such as non-nadir (oblique) or street view imagery. The capability to integrate non-mapping imagery, such as iPhone photos and 360-degree panoramas, enhances the user experience and increases efficiency, ensuring that all relevant data is accessible within a single web app and eliminating the need to switch to other apps.
Other updates
- The Map Layers widget now supports turning all layers on or off at once.
- Attachments can now be viewed in the Table widget.
- The Processing Templates widget works with imagery layers that contains a list of pre-defined raster function templates for changing image layer display.
- The Draw widget adds new snapping tools.
- You can now customize the zoom scale range of 2D maps in the Map widget.
For more information, see What’s new in Experience Builder.
ArcGIS Data Pipelines
ArcGIS Data Pipelines is a new native data integration capability in ArcGIS Online, offering a drag-and-drop visual diagramming interface for creating data integration workflows. You can connect to data, either from disk or in the cloud, use common engineering tools to easily clean and transform the data, and then write the processed results out to a hosted feature layer, ready for use across the ArcGIS system.
Data pipelines can be run interactively or on a recurring schedule, helping you to ensure that data is kept up to date even when the source data is changing. The following are new or updated:
Search and sort element notes
You can now sort and search your element notes. You can sort by date created, date modified, or the element label as it appears in the diagram. You can search notes based on the note content, the element type (for example, “File” or “Filter by attribute”), or the element label as it appears in the diagram.
New Summarize Attributes tool
The Summarize Attributes tool simplifies data preparation by allowing users to summarize data based on non-spatial attributes. Users can select specific attributes and generate statistics like COUNT, SUM, or MEAN, making data preparation more efficient and insightful.
Other updates
Map fields now supports mapping nested input dataset fields to target fields. For example, if you have a field of type struct containing a nested string field, and a string field in the target dataset that you want to map it to, you can now browse into the struct field to map the nested string field.
Filter by attribute now supports the following new expression types for date and date only fields:
- is this month—Filter for records that occurred this month.
- is this year—Filter for records that occurred this year.
For more information, see What’s New in ArcGIS Data Pipelines (February 2025).
ArcGIS Velocity
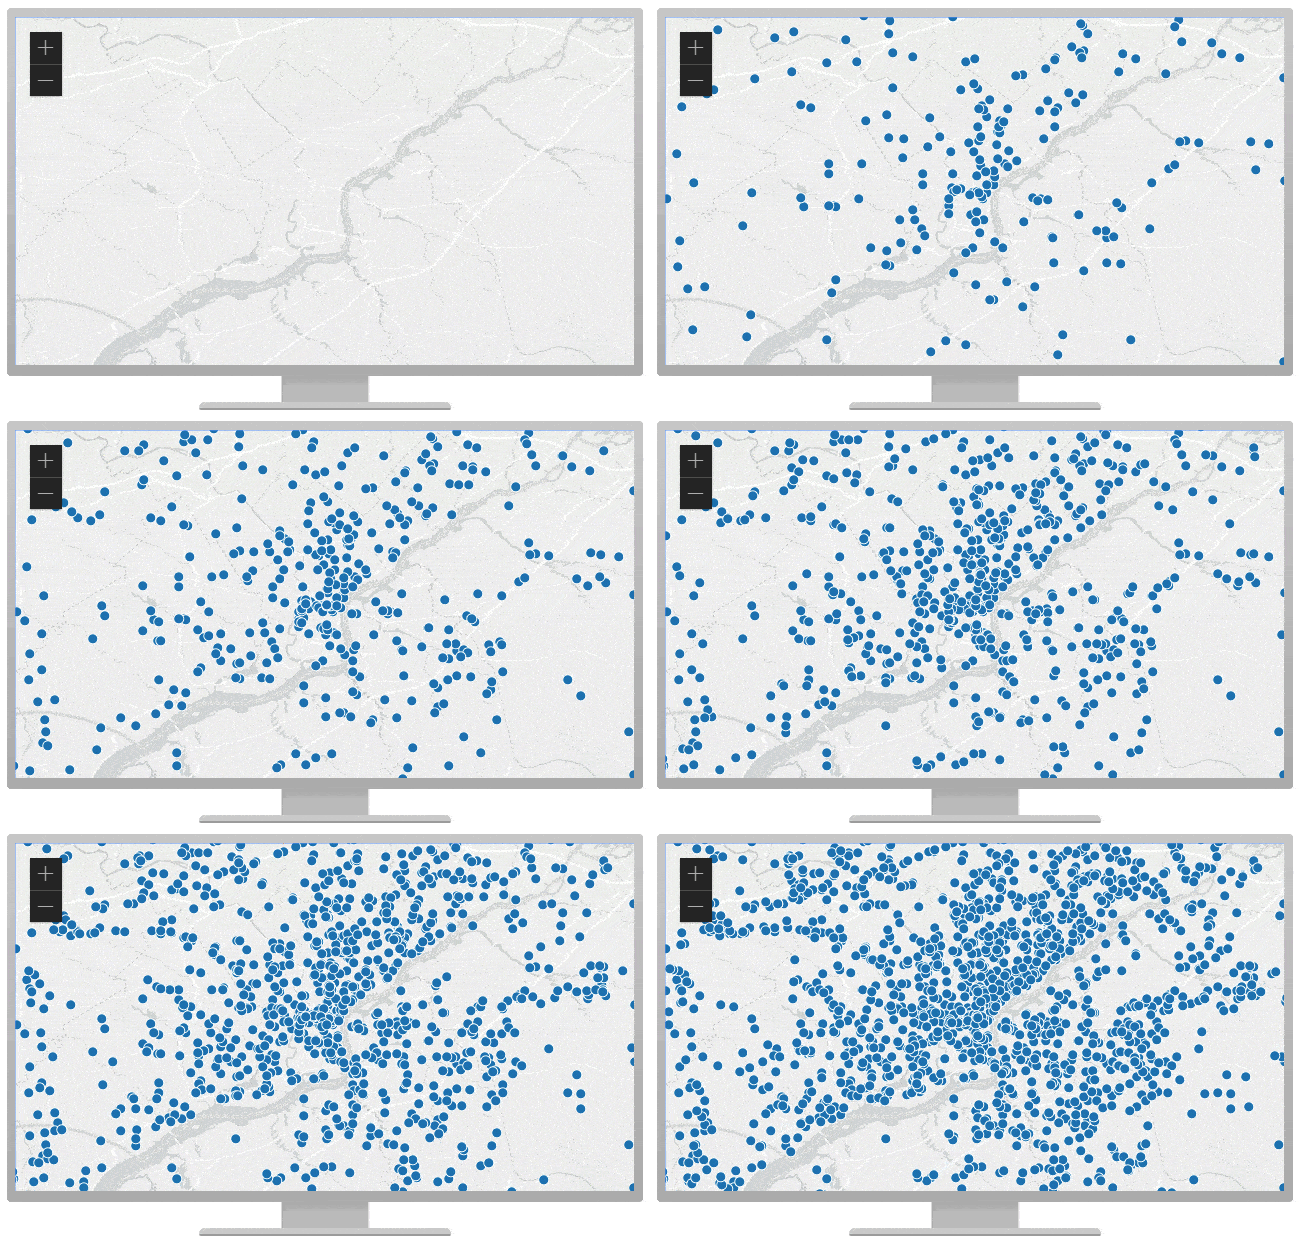
ArcGIS Velocity is a cloud-native add-on capability for ArcGIS Online that enables users to ingest data from the Internet of Things (IoT) platforms, message brokers, or third-party APIs. It also helps users process, visualize, and analyze real-time data feeds; store those feeds as big data; and perform fast queries and analysis.
Recent updates include the following:
FlightAware and Weather Feed integration
The FlightAware feed type enables users to bring in global airborne and surface data from their FlightAware subscription into ArcGIS Velocity. This integration enhances decision-making and situational awareness by combining global air traffic information with the user’s operational geospatial data.
Additionally, users can leverage the Baron Weather feed type to access hyper-local real-time weather data from Baron Weather within Velocity. This empowers users to enhance safety measures and mitigate the effects of severe weather conditions on their operations. Connecting to the FlightAware and Baron Weather feeds requires an API URL and API Key, which can be obtained directly from the provider.
Microsoft Teams and Slack output destinations
By enabling Microsoft Teams and Slack as output destinations in ArcGIS Velocity, users can seamlessly share real-time alerts and insights with their preferred communication channels. This minimizes the need to switch between applications, promoting immediate collaboration and action with apps that staff or personnel already use regularly. Furthermore, because security measures make SMTP and email configurations increasingly difficult for many organizations, this enhancement provides an additional option for alerting and notifications.
For more information, see What’s new in ArcGIS Velocity (February 2025).
ArcGIS Dashboards
ArcGIS Dashboards enables users to convey information by presenting location-based analytics using intuitive and interactive data visualizations. Dashboards are used to help make decisions, visualize trends, monitor status in real time, and inform their communities.
The February 2025 update of ArcGIS Dashboards includes enhancements, bug fixes, and performance improvements. Highlights of the update are listed below.
Dual-axis charts
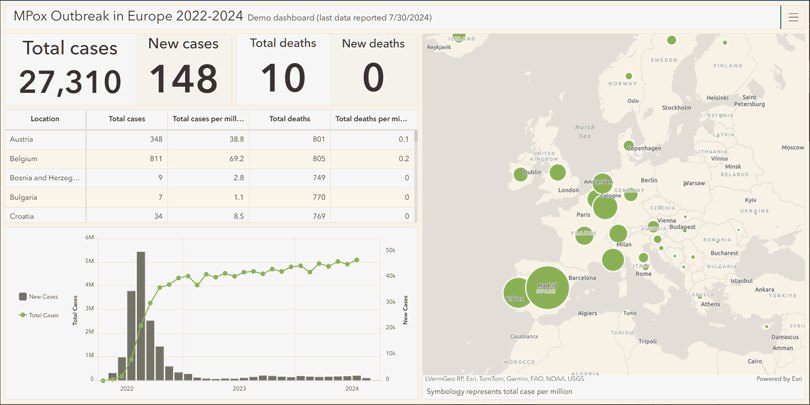
You can now create a dual-axis chart in a multi-series features serial chart. The secondary value axis becomes visible in the chart when two or more series are added to a feature chart and when a series is assigned to the Secondary axis in the Series tab.
Element headers
Element headers are now available in the General tab to provide consistent styling for titles and include the More information tool. The More information tool provides authors with an option to include disclaimers, metadata, or background information.
Web analytics
Dashboard authors can now use Google Analytics with a measurement ID in dashboards under Analytics on the action bar. The configuration includes an optional consent message which can be used to allow a viewer to opt in to analytics collection.
For more information, see Discover what’s new in ArcGIS Dashboards (February 2025).
ArcGIS Notebooks
ArcGIS Notebooks provides a Jupyter notebook experience optimized for ArcGIS, allowing users to combine sophisticated spatial algorithms with powerful open-source Python libraries to develop advanced spatial data science models. ArcGIS Notebooks reduce time spent managing dependencies across data science ecosystems and increase cross-team collaboration and transparency. Updates for Notebooks include:
In this update, the maximum number of active notebook tasks per user has increased from 5 to 10.
ArcGIS Web Editor
ArcGIS Web Editor is a web-based editing app that provides a focused, efficient editing experience in ArcGIS Online. Web Editor combines tools you’re already familiar with, such as snapping, templates, and forms, along with new capabilities.
Batch attribute updates
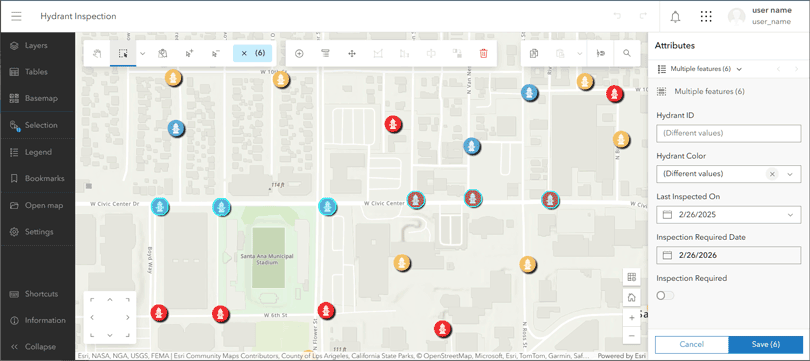
In ArcGIS Web Editor, users can now select multiple geographic features within the same feature class or layer and make batch edits to attributes. The update enables users to edit one or more attributes and have those edits applied to all features at once, helping save time and speed up editing workflows. For example, a code enforcement officer can select all houses on a block and mark them as ‘inspection complete’ or add the date for the last inspection in a single action.
Content Store for ArcGIS
Content Store for ArcGIS is a new app for premium commercial satellite imagery that can be obtained from ArcGIS Marketplace. The app provides a single access point to high-quality, ready-to-use satellite imagery from multiple leading providers. Select an area of interest, choose dates, then review results before adding the desired imagery to the cart.
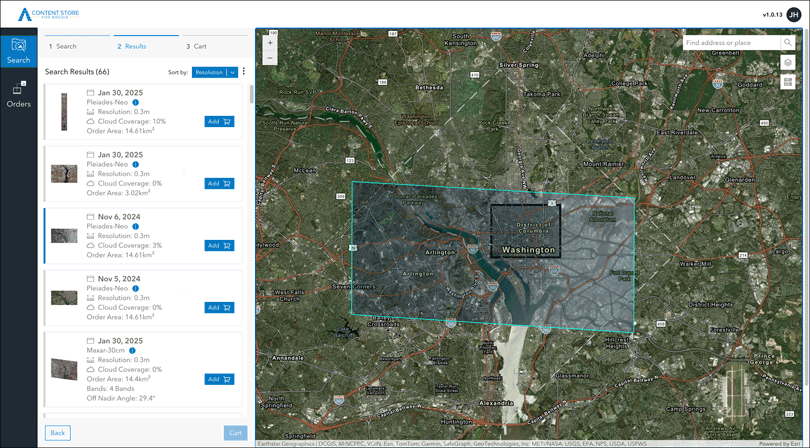
Content Store simplifies the process of purchasing commercial satellite imagery for organizations and enables GIS users to quickly discover, integrate, and use it seamlessly within their projects. Data procurement managers benefit from streamlined purchasing processes, while end users can accelerate their access to the satellite imagery needed to optimize their projects.
By integrating commercial satellite imagery with imagery data from ArcGIS Living Atlas and other open-data repositories supported by various government and commercial organizations, users can leverage a diverse range of sources to enhance their spatial analyses, ensuring a comprehensive and well-informed decision-making process.
For more information, see Enrich Your GIS with Premium Commercial Satellite Imagery.
ArcGIS Living Atlas
Find ready-to-use, trusted content from the GIS community in the form of layers, maps, apps, tools, and 3D scenes. Easily access this collection of content to quickly kickstart your ArcGIS Online workflows, saving you time and effort.
Living Atlas content is published and updated regularly. For the latest news and information, see the ArcGIS Living Atlas home and the ArcGIS Living Atlas blogs. The following are highlights of new spatial content available within Living Atlas.
2019-2023 American Community Survey (ACS) layers
The 2019-2023 American Community Survey (ACS) five-year estimates are now available within ArcGIS Living Atlas. These ready-to-use layers empower people to instantly begin to explore, map, and analyze the data. The multi-scale layers have data for state, county, and tract levels. See the ACS layers in Living Atlas, open the Current-Year ACS Map and App Examples group, or view the American Community Survey Atlas Collection.
For more information, see:
- Map the newest American Community Survey (ACS) content.
- Introducing the American Community Survey (ACS) Atlas Collection.
Global Wind Atlas
The Global Wind Atlas, the result of a partnership between the Department of Wind Energy at the Technical University of Denmark and the World Bank group, delivers Living Atlas layers to assess wind energy resources for policy and planning. The layers include wind speed, power density, and capacity factor. For more information, see Explore the Global Wind Atlas.
Global Fishing Intensity
Two new global fishing intensity layers have been added: Global Fishing Intensity (Year 2020) and Global Fishing Intensity – Month Time Series (Year 2020). These are 1-km resolution multidimensional image services published from Global Fishing Watch and providing a global view of fishing activity. For more information, see Global Fishing Watch – Illuminating vessel activity on the open ocean.
NAIP 2023 imagery
This layer features recent high-resolution (1m or better) aerial imagery for the continental United States, made available by the USDA Farm Services Agency via the National Agriculture Imagery Program (NAIP). The NAIP image service has now been updated to include the NAIP 2023 imagery, now with coverage from 2010 through 2023. For more information, see NAIP 2023 imagery is now available in Living Atlas.
Sentinel-2 Explorer
Sentinel-2 Explorer is the latest addition to the collection of Living Atlas apps, which leverage Living Atlas content in visually stunning apps for visualization and analysis. Sentinel-2 Explorer provides access to the full archive of Sentinel-2 Level-2A imagery, which offers greater spatial resolution and unique spectral capabilities for monitoring global land change associated with climate, urbanization, drought, wildfire, deforestation, and other natural processes, disasters, and human activity. For more information, see Sentinel-2 Explorer: another level of Earth observation.
Optimized imagery for analysis
Select ArcGIS Living Atlas of the World imagery layers can now be optimized for raster analysis. Currently, Landsat Level-2, Sentinel-1 RTC, Sentinel-2 Level 2A, and NAIP imagery layers are supported. This feature is currently in beta, and is turned off by default.
World Imagery is also available for automated information extraction in ArcGIS Pro. This workflow requires the Image Analyst extension and installation of the deep learning frameworks. For more information, see Learn to use AI to extract information from World Imagery.
More information
For more information and additional details about this update, see the What’s new help topic or view all posts related to this release. You can also watch an introductory video to see new capabilities in action.
Visit the ArcGIS Online Esri Community to ask questions, view blogs, learn from peers, and submit your ideas for future enhancements.


Commenting is not enabled for this article.