National Aeronautics and Space Administration’s (NASA) mission, Tropospheric Emissions: Monitoring of POllution (TEMPO), collects air quality measurements to understand air quality and pollution sources. These measurements help us understand pollution sources and their impact on people and climate. TEMPO data provides hourly measurements of ozone, nitrogen dioxide (NO2), formaldehyde, and other constituents in Earth’s atmosphere.
The Level 3 data consists of approximately one-hour scans during daylight over North America. The TEMPO instrument measures light sensitive to visible (VIS) and ultraviolet (UV) wavelengths. It covers a spectral range of 290-490 + 540-740 nm and 0.6 nm spectral resolution. NASA has released the Tropospheric Emissions: Monitoring of Pollution (TEMPO) Nitrogen Dioxide Vertical Column Troposphere Beta layer on ArcGIS Living Atlas of the World. This Level 3 product offers a spatial resolution of 0.02 x 0.02 degrees (2.2 x 2.2 kilometers). For more information, visit the NASA Atmospheric Science Data Center (ASDC). The ASDC archives TEMPO data and provides citation steps.
This blog explains how to perform multidimensional analysis with TEMPO NO2 data in ArcGIS Pro 3.3. Tracking air quality changes over time with multidimensional analysis due to air pollution can provide valuable insights for public health and environmental monitoring. You can choose an area or event of interest for your projects. The TEMPO NO2 ArcGIS Living Atlas Level 3 product has been converted from its native netCDF4 format to a multidimensional Cloud Raster Format (CRF). CRF is Esri’s preferred choice for storing multidimensional raster data. For details on visualizing and accessing TEMPO NO2 data in ArcGIS Online from the Living Atlas, refer to the blog here.
Explore TEMPO data in ArcGIS Pro
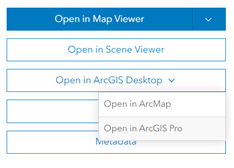
Esri’s Cloud Raster Format (CRF) is the default output format for geoprocessing tools that generate multidimensional rasters. It supports efficient storage and retrieval of large multidimensional raster files in distributed environments. To access TEMPO data in ArcGIS Pro, navigate to the Living Atlas. Select ‘Open in ArcGIS Desktop,’ then choose ‘Open in ArcGIS Pro.’ Lastly, double-click the downloaded item.pitemx file to open it in ArcGIS Pro.
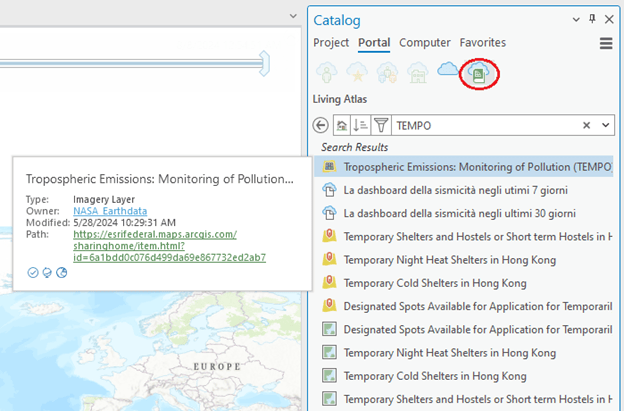
TEMPO data can also be accessed in ArcGIS Pro via the Portal. Navigate to the Living Atlas and search for “Tropospheric Emissions TEMPO.” Once found, right-click the search result and select a method to add the data to your project.
Explore multidimensional analysis tools
Multidimensional data captures information across various times, depths, or heights, making it essential for atmospheric, oceanographic, and earth sciences. In ArcGIS Pro, the Multidimensional tab on the ribbon provides tools specifically designed for this type of data. You can select which data slice to display, view a temporal profile chart, calculate summary statistics, and more. The Multidimensional tab contains the Current Display Slice section with a drop-down menu and toggles to display slices along standard times, as shown below. For easier usage, we recommend using the drop-down menu and toggles instead of the time slider on the map to view your specific time span of interest. Refer to the ArcGIS Pro help documents for a comprehensive list of multidimensional analysis capabilities.
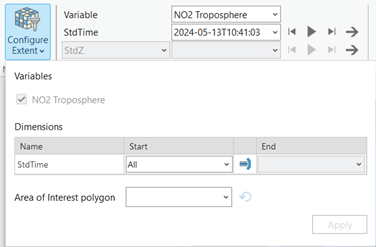
TEMPO data offers extensive spatial and temporal coverage across most of North America, with hourly updates. To refine your data, use the features available in the Multidimensional tab. For instance, you can define a specific study area by choosing “Configure Extent” and selecting a polygon representing your area of interest.
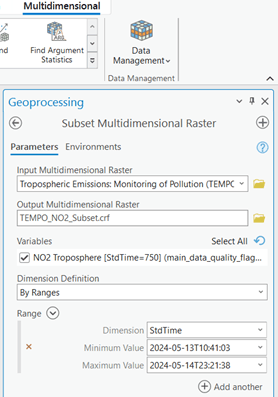
To focus on a specific time frame, navigate to Data Management and select Subset. Choose “By Ranges” for Dimension Definition, then use the drop-down menus to set your study period’s start and end times. After running the Subset Multidimensional Raster tool, go to the Raster Layer tab and click DRA to enhance your data’s display. With your study area and time period defined, you are now ready to begin your analysis using the multidimensional toolset.
Performing multidimensional aggregation (ArcGIS Pro / Online)
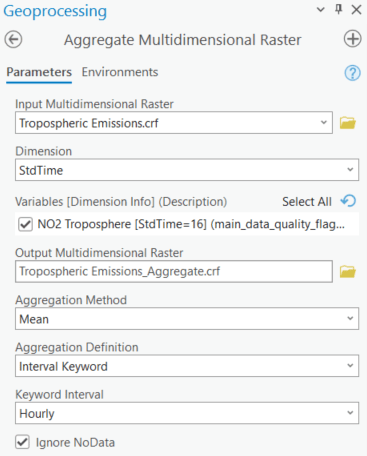
TEMPO data, collected hourly, provides detailed air pollution measurements. To simplify analysis, you can aggregate this data using the time dimension. For instance, you might combine hourly data into daily averages to gain a clearer view of overall pollution levels and changes in air quality. Note that TEMPO data uses UTC timestamps. This can cause daily averages to include data from the early hours of the next day, potentially affecting your analysis.
When aggregating, you can choose different mathematical methods, such as calculating the mean, standard deviation, minimum, or maximum values over the selected time interval. Aggregation can be done daily, weekly, monthly, or using custom ranges defined by keywords, specific values, or date pairs. This approach simplifies the data, making it easier to identify patterns and draw meaningful conclusions.
You can also visualize multidimensional data over time at a specific location using a temporal profile chart. This tool represents data as a time series, offering in-depth visualization and analysis of your multidimensional raster data. For a step-by-step guide on creating a temporal profile chart, refer to this Learn Lesson.
Detecting anomalies
Identifying anomalies in TEMPO NO2 data over time can yield valuable insights for public health, regulatory compliance, environmental protection, and pollution source identification. To find deviations in TEMPO’s observations, compute anomalies for each slice in your multidimensional raster for multiple variables at specific time intervals. You can choose from various calculation methods, such as the difference from the mean.

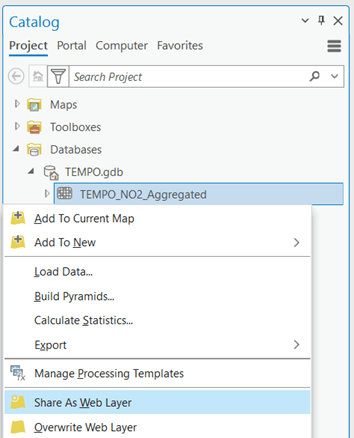
In ArcGIS Pro, you can share your processed data as a Web Layer. To do this, navigate to the raster in the catalog and select “Share as a Web Layer” in Enterprise. This Imagery Layer can then be used in Enterprise or saved as a Web Map in ArcGIS Online.
In this blog, we covered how to subset TEMPO data, perform aggregation, and detect anomalies. We hope this workflow inspires you to explore other multidimensional analysis tools and datasets for your research. To learn how to create a scientific application with ArcGIS Experience Builder and share it with the public, check out this blog.

So living atlas’ terrain data defaults to the highest resolution available? So for the lower 48 the resolution will be 1/3 arc second at worst, and then LIDAR data if available? Thanks for any feedback you have.
Yes, Terrain is a multi-scale service, comprised of multiple data sources. In US, the lower 48 is covered fully by 1/3 arcsec and then 1 meter 3DEP where available. Please refer elevation coverage map for data extent: https://www.esriurl.com/elevationcoveragemap. Hope it helps!