
September 3, 2024

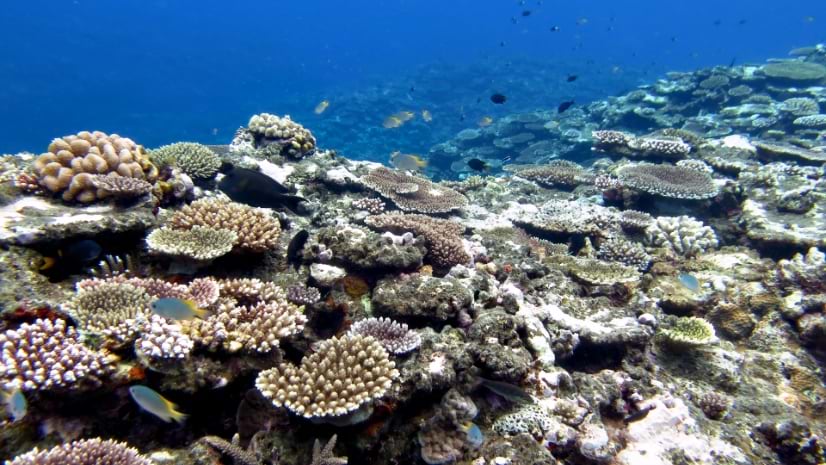
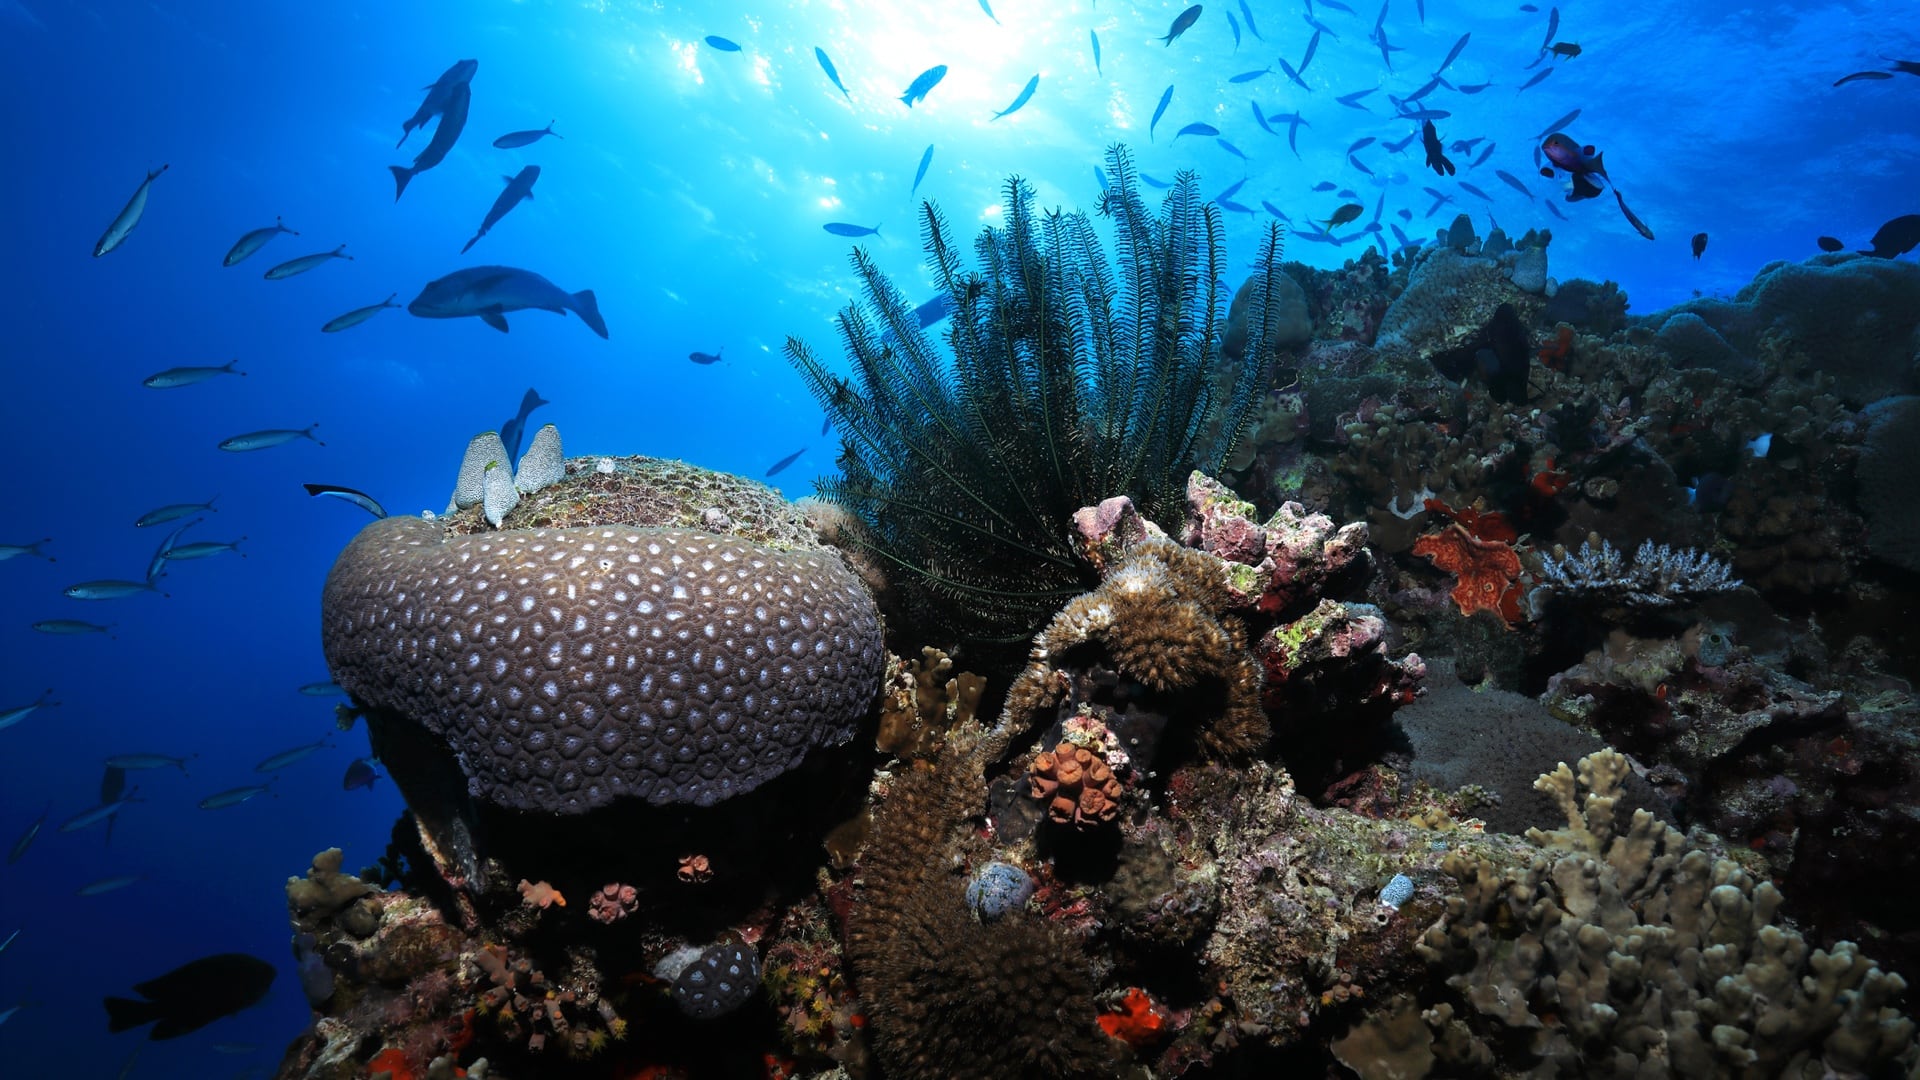
The 100 Island Challenge captured an ecological survey of coral reefs in the Pacific, Caribbean, and Indian oceans. (Photo courtesy of the 100 Island Challenge team at Scripps Institution of Oceanography)
This is a challenging time for coral reefs. Although they cover less than .1 percent of the ocean floor, coral reefs support 25 percent of all marine creatures. Collectively, they form one of the planet’s most important ecosystems. Their health is in jeopardy due to increased ocean acidification, rising temperatures, pollution runoff, and overfishing and other destructive fishing practices.
The news is not uniformly bleak. A global study of coral reefs that seemed wildly ambitious when it launched in 2014 suggests that some coral reefs are showing impressive resilience. Some could even be considered thriving.
From the beginning, managing the study, dubbed the 100 Island Challenge, has depended on a creative and geographic approach.
Geographic information system (GIS) technology helped the 100 Island Challenge scientists define the initial scope of the study. Now it is allowing them to visualize and analyze the data they collect. GIS has also enabled the construction of environmental digital twins. In this case, the highly realistic and navigable 3D models depict many of the world’s major coral reefs, capturing flora and fauna in precise detail.
“I’m focused on coral reefs because it’s a great place to watch animals,” said Stuart Sandin, an ecology professor at Scripps Institution of Oceanography at UC San Diego. “Organisms are packed together, interacting with one another.”
Since the early 2010s, marine ecologists like Sandin have noted how reef health is indicative of a greater overall breakdown in ocean health.
“The timely issue was that we were seeing a ton of degradation,” he said. “It was no longer just a discussion about these ecological principles.” Coral health became a matter of global urgency that highlighted a possible tipping point, with coral decline contributing to biodiversity loss.
Sandin was drawn to the question of local and direct human influences, like overfishing and pollution. He realized that this was, at its roots, a spatial question and it was urgent. If humans were causing harm, changes could be made to reduce the impact. Analyzing the connection involved assessing the influence of humans on nearby reefs.
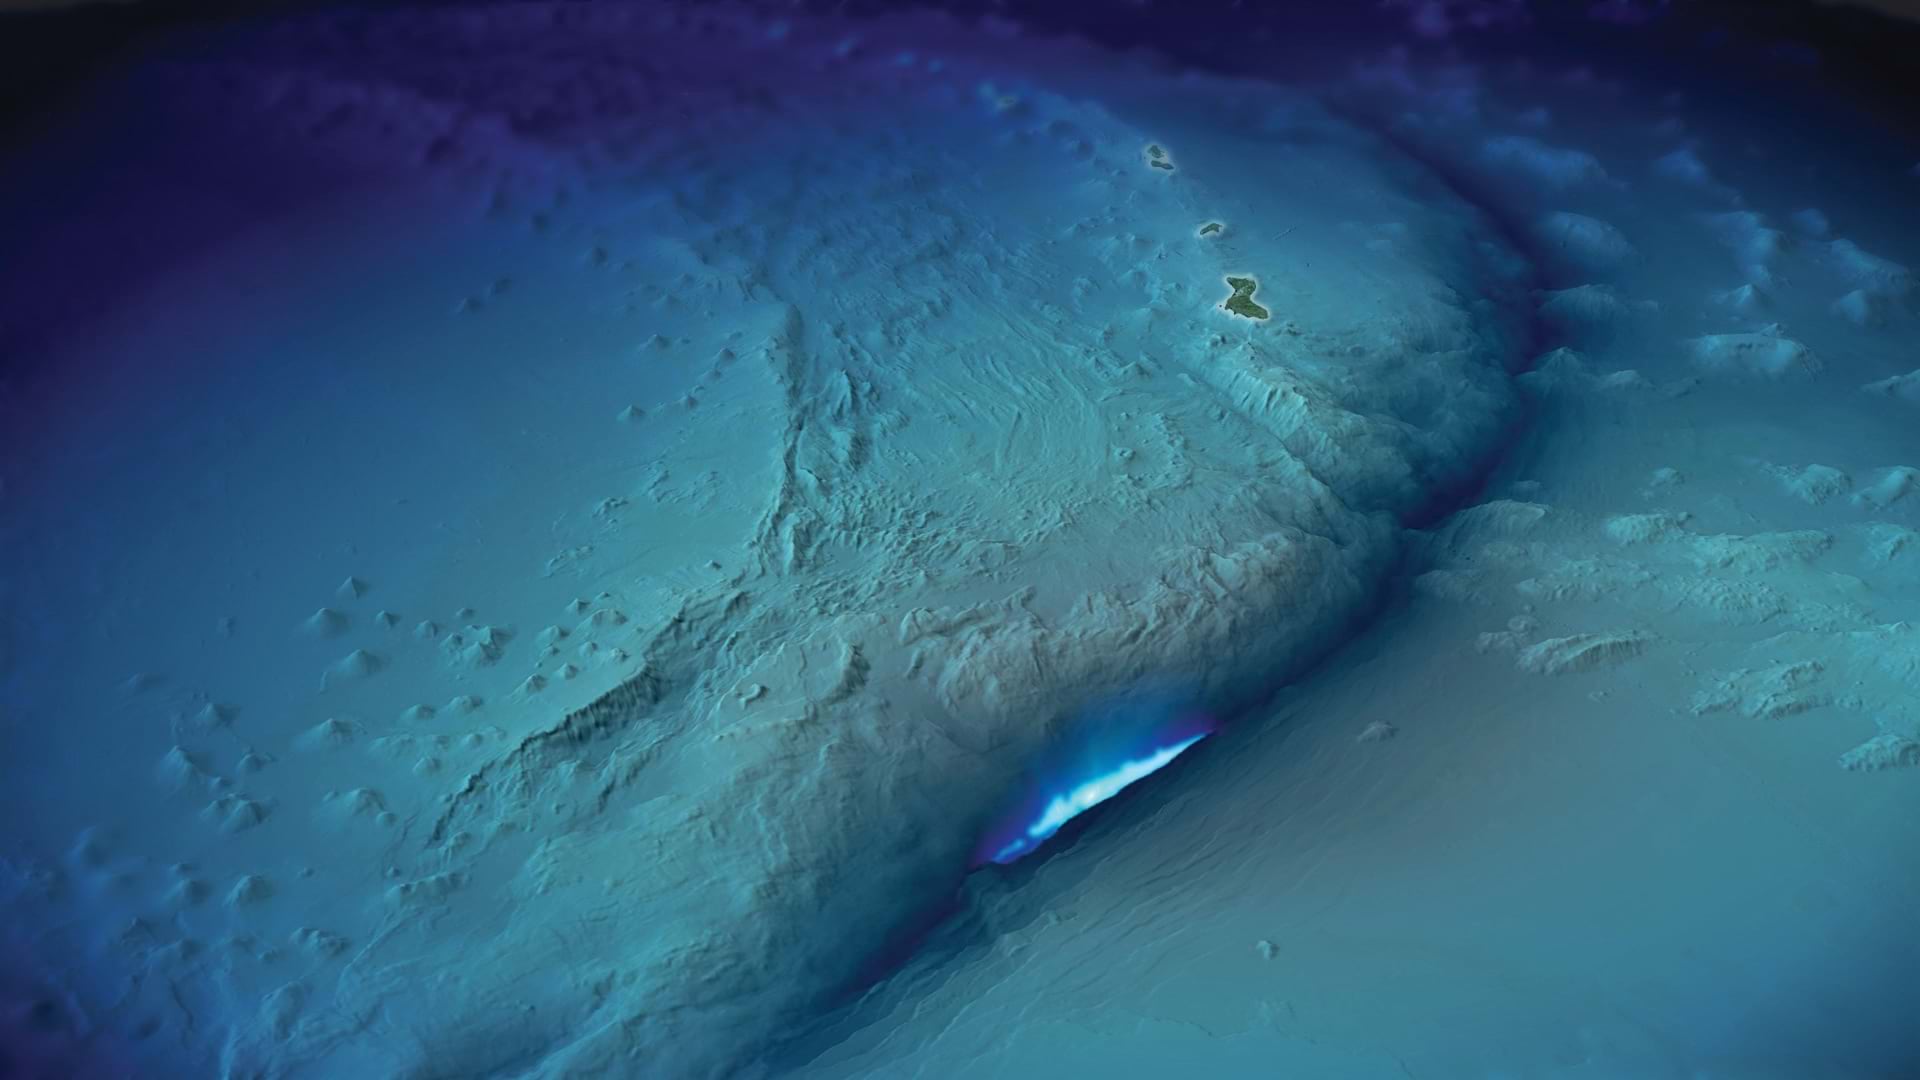
One of the earliest inquiries Sandin and his Scripps colleagues made involved the Line Islands, 11 atolls in the central Pacific Ocean, a thousand miles south of Hawaii. The mix of inhabited and uninhabited atolls belong to the Republic of Kiribati (pronounced “KIR-ee-bas”) and US territories.
Studies of the coral reefs near the uninhabited islands yielded positive results.
“The baseline ecosystems were everything we dreamt of,” Sandin said. “Tons of big sharks, big corals, clean water. We thought it was cool that those conditions still exist.”
When Sandin’s team turned to some of the Kiribati islands with small but growing human populations, the difference was stark. Human activity—particularly the modest amount of fishing done by residents of this small country—had degraded and even destroyed some of the reefs.
The results appeared to speak for themselves. Islands with no human presence had healthy reefs—those with people did not.
As Sandin looked at other islands around the world—including other more distant Kiribati islands—he discovered the strict dichotomy did not hold true. Some inhabited islands that had experienced many generations of fishing still had thriving coral ecosystems. The health of an island’s reef systems was not necessarily determined by human presence.
“I realized the human dimension was more than just binary,” Sandin said. “It wasn’t just presence versus absence. I knew we should start studying the variation of human use, where it works well and where it doesn’t.”
A major challenge of studying ecosystems, even those as spatially concentrated as a coral reef, is the dizzying array of factors that affect their function. Sandin’s team defined 18 types of islands, based on such factors as the size of the human presence and the island’s geography.
The team members decided they should find five island examples of each of the 18 classifications, meaning the project was committed to studying 90 islands. Then they decided that adding 10 islands, bringing the total to 100, would give the study a more impressive pedigree. “We rounded up to make the T-shirts look better,” Sandin joked.
From the beginning, the 100 Island Challenge presented logistic hurdles. Sandin’s team had to research islands for possible inclusion, classify them, and maintain a globally dispersed atlas of candidates. The islands chosen are mostly concentrated throughout the Pacific, the Indian Ocean, and the Caribbean Sea. The team has attempted, whenever possible, to work with residents on each island to both ensure respect for its culture and maximize local knowledge.
“Every island has a story,” Sandin said. “And that’s why we had to go bigger.”
GIS maps played a key part of building the massive atlas, giving the team members an ongoing reference as they gathered data. The team aimed to visit each island in the study at least twice to monitor changes over time.
GIS also provided a way to determine specific observation sites for every island. From each of these vantage points, researchers can visualize key spatial relationships, including the location of reefs and human settlements, the size and extent of fishing industries, and freshwater sources that flow into the ocean.
The maps promote transparency. Shared with people who live on the inhabited islands, GIS maps help everyone understand the study’s objective of measuring ecological health.
The maps also support the data-gathering process, which includes both low- and high-tech components. Divers swim the reefs, making observations that fall in various categories, such as coral conditions and the amount of wildlife. These categories become individual data layers on the map.
Divers carry still cameras that record one geotagged image every second. This amounts to millions of images added to the map, documenting the conditions of reefs for further study.
“One of the first things we observed, with the help of image-based mapping products, is that the idea that every coral on the planet is suffering is a complete fallacy,” Sandin said. “What’s actually happening is that every coral on the planet is growing. But in patches, we’re seeing a lot of them die.”
The situation may not be universally dire, Sandin added, but it is urgent.
“Every coral we see is fighting,” he said. “They’re getting hit, site by site, by different stressors, like pollution and overfishing, and some of the hot-water events they can’t recover from. But there is resilience.”
The data-gathering cameras serve a dual purpose. They document reefs that have not been able to recover from the stressors, particularly those linked to climate change. At the same time, the cameras serve to document the resilience. Both objectives help researchers understand how coral can thrive under modern conditions.
The amount of data collected by the 100 Island Challenge is staggering. And it’s all feeding into the digital twin.
“Right now, we’re actively involved in finding a way to deal with this petabyte of data, making it transparent and accessible,” Sandin said. “That’s where a lot of these spatial analytic tools and all the creative approaches to visualize data really come into play.”
Thanks to advances in data processing and GIS-enabled imaging, millions of images can be processed quickly. Aided by game engines, computers can stitch together realistic 3D digital twins of the reefs.
Scientists and GIS novices alike can, in effect, explore the reefs in stunning detail. The resolution, which approaches millimeter level, is high enough to see baby coral. The digital twins have also helped scientists understand the dispersal of adolescent and adult coral. GIS tools can even measure the buffering zones around different coral types in various stages of development to see how they interact with each other.
For those whose lives are deeply entwined with the reefs, the study’s GIS maps show the coral’s struggle to save itself.
“One of the stories that really struck me was when we were meeting with one of the governors of the southern states in Palau,” Sandin said. “We showed him printed maps and he said, ‘I’m a fisherman, and the fish talk to me. They can tell me what’s wrong. If there are too few fish, I go somewhere else. But the reef has never had a voice.’”
As Sandin recalled, the governor pointed to the map. “This,” he said, “gives the reef a voice.”
Learn how GIS technology is used to explore, map, visualize, analyze, and protect the oceans.
Gain more background on the use of GIS for the 100 Islands Challenge in the Esri-produced video below.


