In social science research, there is growing recognition of the significance of space, place, and spatial analysis. Research institutes such as the Center for Spatially Integrated Social Science (CSISS) at the University of California, Santa Barbara, have long championed this geographic slant toward social science and, accordingly, the need for social scientists to embrace a computational approach to their work when appropriate. Yet for many social scientists—especially in sociology, economics, history, political science, psychology, anthropology, human geography, ethnography in archaeology, and even the digital humanities—mapmaking is as far as they go. The power of GIS, however, lies in the analysis that’s done behind the map. And there is still a major need to strengthen the awareness of geographic information science (GIScience) principles among social scientists.
Many social scientists will happily perform simple regression analyses on spatial data. What they don’t realize is that Tobler’s First Law of Geography—that everything is related to everything else, but near things are more related than distant things—violates the assumptions made in these analyses. Additionally, it’s easy to find in published social science studies instances of ecological fallacy—the erroneous assumption that an inference about an individual applies to the broader population to which that individual belongs, especially spatially. There’s also a lack of awareness of the modifiable areal unit problem (MAUP), the profound notion that when data is reduced to more basic spatial units, the results of any analysis of that data will change when those basic spatial units change.
So many researchers still struggle with how to best integrate quantitative and qualitative geographic data. What an impact it would have if GIS were seen by social scientists as the gold standard for implementing spatial methodologies.
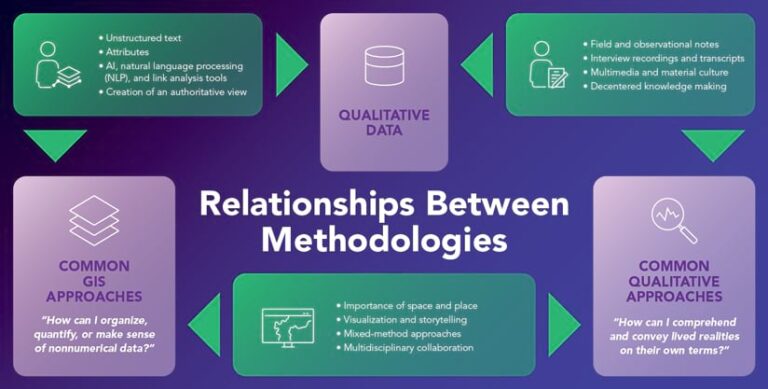
To that end, Esri has formed its new Social Science Collaborative, a small task force of trained social scientists at Esri (many of whom have PhDs) who are developing very specific projects and resources as solutions to the issues cited above. While quantitative social science has been served well by GIS, not as well-known is how suitable GIS can be for the qualitative side of the discipline—that is, conducting interviews and focus groups and analyzing texts. Part of the focus of this collaborative is to not only make ArcGIS technology easy for social scientists to adopt and use but also ensure that this comes with easy access to related documentation, workflows, use cases, apps, tutorials, and more, on issues such as the ecological fallacy, the MAUP, uncertainty in data, social justice, racial equity, and the ethics of data privacy and artificial intelligence (AI).
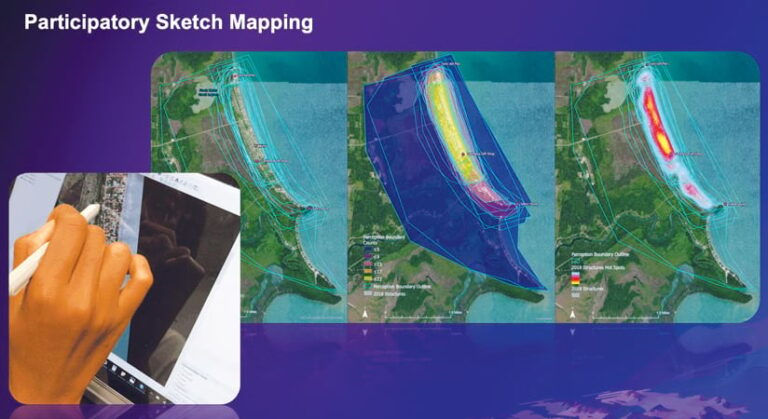
The collaborative made a great start in 2021 by offering the first of what will hopefully be an annual technical workshop at the Esri User Conference (Esri UC). Called Enhancing Qualitative Social Science Research with GIS, the workshop showcased the power and utility of ArcGIS technology for qualitative social science—especially to address current and long-standing issues of racial equity, population and demographic studies, economic and environmental justice, public health, and community resilience to climate change. Technical topics ranged from learning how to configure ArcGIS Survey123, ArcGIS Field Maps, and ArcGIS QuickCapture for field-based qualitative data collection to exploring spatial data, producing geospatial visualizations, and using GIS-based analysis and presentation tools (including how to bridge ArcGIS technology with other qualitative data analysis packages). The workshop showed several hundred virtual attendees just how much ArcGIS has to offer to social scientists who need to employ qualitative, as well as quantitative and mixed-method perspectives, in their work.
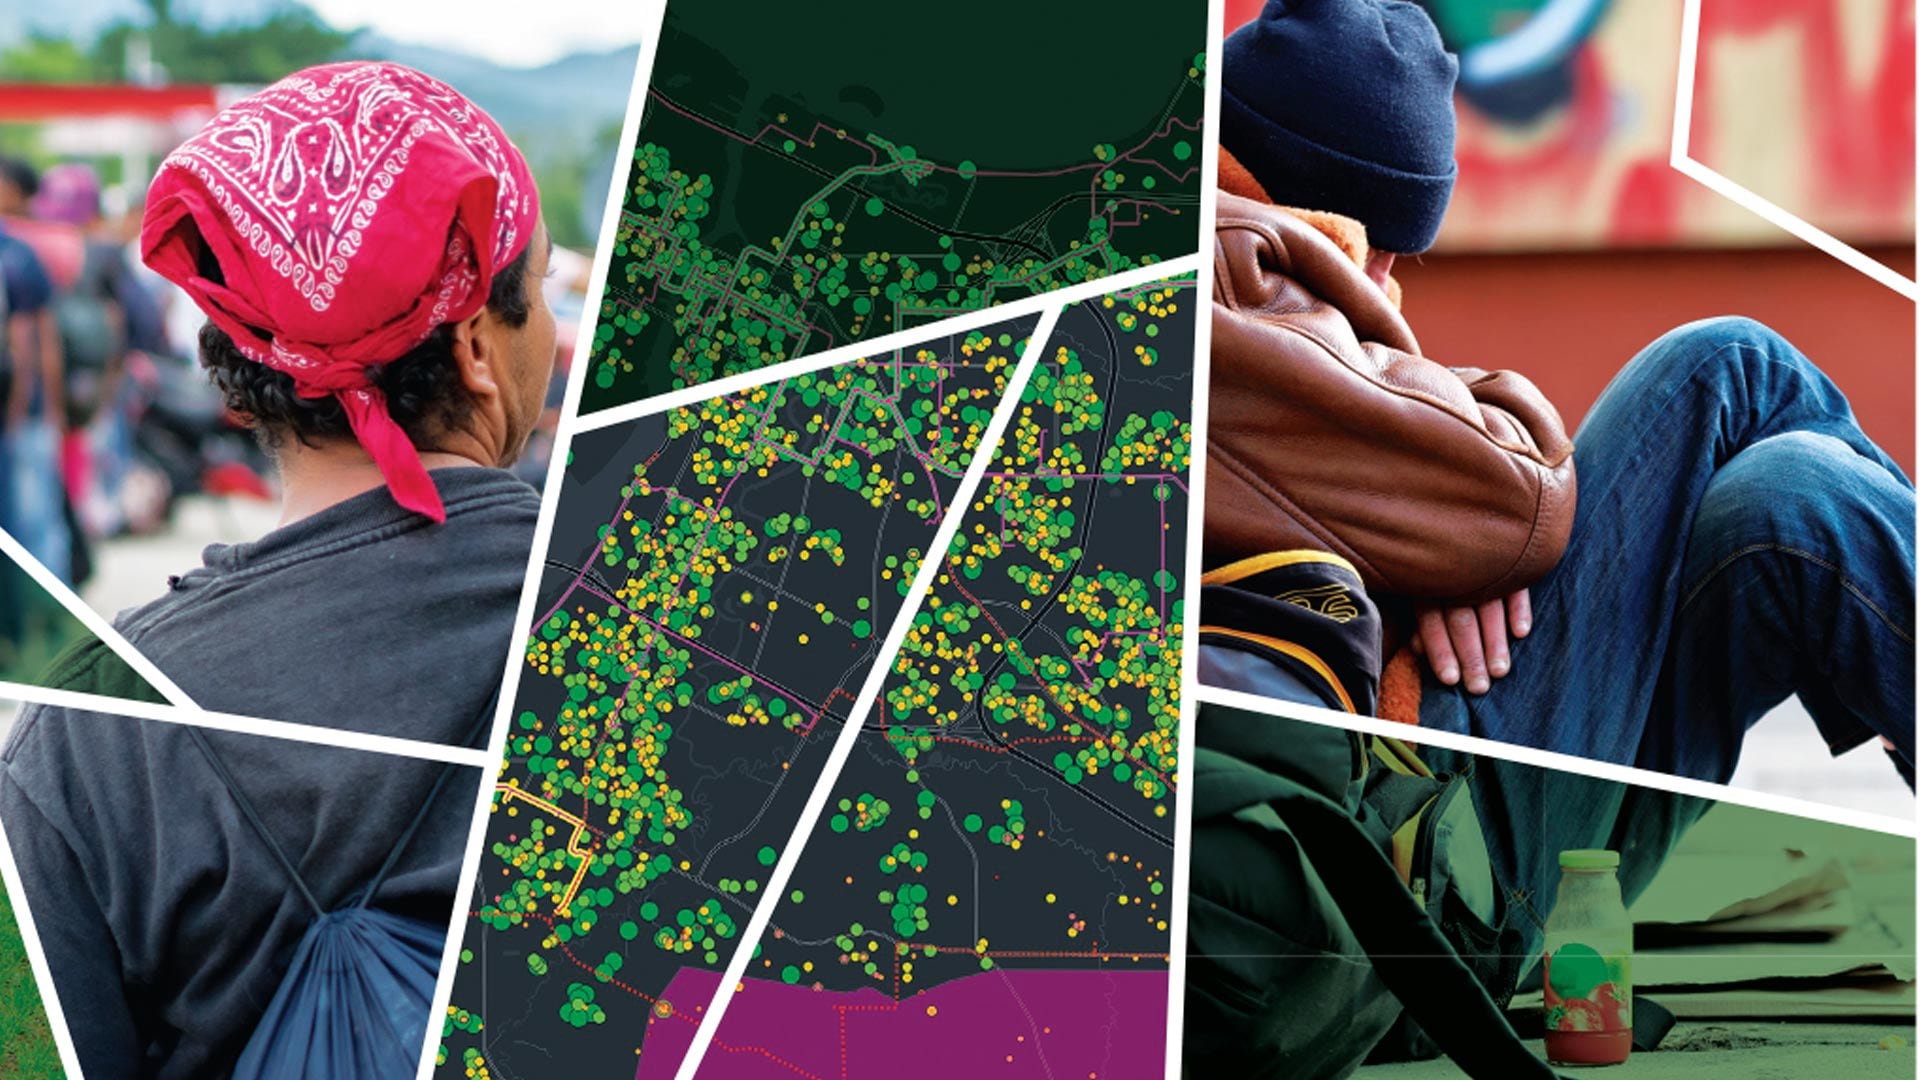
In the summer of 2022, members of the collaborative participated in a webinar, put on by the National Academy of Sciences’ Mapping Sciences and Geographical Sciences committees, called Humanitarian Responses to Forced Migration and Displacement: New Insights from Quantitative and Qualitative Geographic Data. Their presentation used ArcGIS Insights and ArcGIS StoryMaps to show how both quantitative and qualitative data and tools can track human movement and displacement in near real time. They also explored some of the limits, opportunities, and errors associated with these datasets and how to best visualize and communicate them.
At the 2022 Esri UC, the collaborative followed up with another tech workshop augmented with new demos featuring ArcGIS Insights, ArcGIS Knowledge, GeoAI, and crowdsourcing with ArcGIS StoryMaps. It also put on another webinar, Enhancing Qualitative Social Science Research with GIS, for several hundred registrants.
In addition to providing a way to compile and create best practices and online resources, these workshops and webinars promote community. With this community-building goal in mind, members of the collaborative also aim to attend more of the conferences that social scientists frequent, such as the annual meetings of the American Sociological Association and the American Anthropological Association. The collaborative will continue to reach out to prominent programs and institutes—such as Spatial@UCSB; the Australian Urban Research Infrastructure Network (AURIN); and universities including the University of Chicago, the University of Toledo, Brown University, Harvard University, the University at Buffalo, the University of Central Florida, New Mexico State University, and UMass Global—to collaborate on projects and establish more resources. Additionally, members will be engaging with organizations such as the American Library Association, the Association of College & Research Libraries, the Educational Testing Service (regarding relevant content that could be included in high school advanced placement human geography and geographic information science and technology classes), and several Esri distributors that focus on higher education (such as those in Japan, the Netherlands, and Germany as well as throughout Africa). Finally, the collaborative would like to invite researchers, librarians, and practitioners to write ArcGIS Blog posts about their social science research and create other kinds of content about what they do and how they employ ArcGIS technology.
In sum, Esri’s new Social Science Collaborative is singularly focused on using and improving GIS to strengthen how qualitative and quantitative data and methods work together within the social sciences. The aim is to illuminate how GIS provides an organizing context that makes both the data and information more accessible and usable, generating powerful insight about problems that range from racial equity and climate-driven migration to global health challenges.
And while CSISS and other centers have been pioneering these advancements since the late 1990s and early 2000s, much more needs to be done. For example, manual data preparation and manipulation processes are too time-consuming, especially as many kinds of qualitative data are still not well supported in GIS tools. There is a definite lack of integration between GIS and computer-assisted qualitative data analysis software (CAQDAS) tools, and the tools that exist can still be nonintuitive and difficult to use. Indeed, these tools’ user interface/user experience (UI/UX) need to be improved with better design and new features, functionality, and workflows.
There are so many opportunities for innovation, which speaks to the heart of Esri’s research and development needs and goals. And this leaves those of us in the collaborative wondering, What would you like to see improved in ArcGIS technology when it comes to using it for qualitative and broader social scientific research? Please reach out to me at dwright@esri.com or the collaborative at socialscience@esri.com, and look for the hashtag #EsriSocSci on LinkedIn and Twitter.
