More Ways to Increase Productivity
By Jason Pardy, Esri Product Engineer
Take advantage of iteration in ModelBuilder
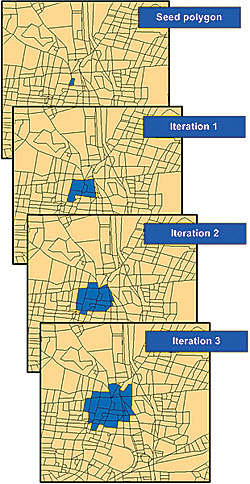 |
| As the model iterates, the selected set of features expands. |
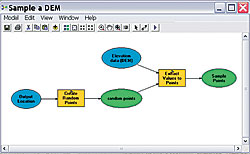 |
| Figure 1: A model to sample a DEM |
ArcGIS 9.2 has improved user productivity in many ways. ModelBuilder, an application in ArcGIS that is used to create, edit, and manage models, now includes iteration functionality. Also called looping, iteration means repeating a process using different input parameters each time until a result is achieved. ModelBuilder can streamline geoprocessing tasks by iterating an entire model or individual process. This article describes the iteration methods available in ModelBuilder. Those methods are
Iteration Using a Count
One of the easiest ways to instruct a model to iterate is by setting the count. With this method, the user specifies how many times the model will execute. In Figure 1, the model samples elevations from a digital elevation model (DEM), randomly creates points covering the extent of the DEM, and extracts the values of the DEM to points. The iteration count is set to 5 using the Model Properties dialog box. Because the model produces one output dataset for each iteration, it is important to have a unique output name for each iteration. The current model iteration is represented by %n% where the first iteration is zero. The value of the Output variable is SamplePoints_%n%.shp. The five output datasets would be
C:\Outputs\SamplePoints_0.shp

C:\Outputs\SamplePoints_1.shp

C:\Outputs\SamplePoints_2.shp

C:\Outputs\SamplePoints_3.shp

C:\Outputs\SamplePoints_4.shp
Using a Variable to Set the Iteration Count
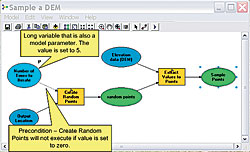 |
| Figure 2: Using a model variable to set the iteration count |
Instead of typing a fixed value in the Model Properties dialog box, a model variable can be used to get the iteration count. In Figure 2, the model from the previous example was modified to contain a new variable, named Number of Times to Iterate, that has a Long data type. This variable has been made a model parameter so that a user of the model can input the iteration value using the tool's dialog box. From the Iteration tab in the Model Properties dialog box, a variable in the model can be selected to set the iteration count.
Iteration Using Feedback
 |
| Figure 3: A viewshed probability model using feedback |
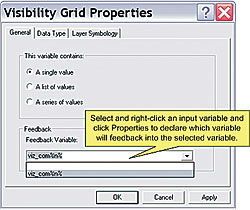
In ModelBuilder, the output of one process can be used as the input to an earlier process using feedback iteration. As shown in Figure 3, the model created to sample a DEM was expanded to perform further analysis and illustrates how error on the source DEM might affect delineating a viewshed from an observation point. This model uses feedback and an iteration count to combine different viewsheds into a probability viewshed. The output raster will contain cell values ranging from zero to the iteration count set by the user. For example, if the iteration count is set to 100, each cell value in the final output raster will range from zero to 99. If a cell value is 50, this means the cell was visible 50 times out of 100. Declare a variable as feedback by opening the Model Properties dialog box for the input variable and selecting the output variable that will be fed back into the model as input.
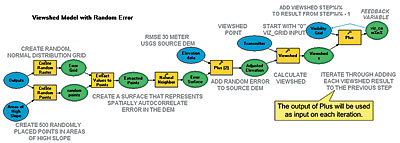 |
| Figure 4: The Visibility Grid variable properties |
Iteration Using Series
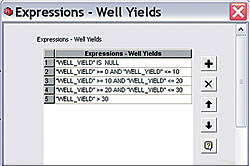 |
| Figure 4a. A model to reclassify values using a series. |
Often, it is necessary to execute a model on a series of inputs. In this situation, the entire model is executed once for each value in the series. Figure 4 illustrates the use of a series for model iteration. This model reclassifies groundwater yield by geology into different yield classes. For example, groundwater with 0 to 10 liters per minute is classified as 1. The completed model is shown in Figure 4. Figure 4a shows Expressions—Well Yields, a series variable. Opening this variable displays a series of yield class expressions. The model will execute once for each expression. The Expression parameter for Calculate Field is set to the iteration (%n%). The last step is to set its iteration variable by opening the Model Properties dialog box and selecting the variable Expressions—Well Yields as the iteration variable. When a variable is selected for iteration, the iteration count value is ignored and the model will iterate once for each value in the series variable.
Iteration Using a Boolean Condition
A different scenario was used to demonstrate iteration using a Boolean condition.The basic model shown in Figure 5 constructs a sales territory. In the BlockGroups feature class, a field named NCustomers contains the number of customers per polygon. The seed polygon contains the central office location of the sales territory. Beginning with the office location, the model gathers contiguous groups of polygons until the total number of customers crosses a threshold such as 350 total customers.
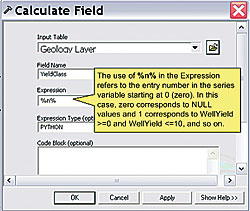 |
| With a series variable, expressions can be added, removed, or modified. |
The model begins by selecting polygons by location. The output of the Select Layer By Location tool is input to the Summary Statistics tool to calculate the sum of the NCustomers field for all selected records. The Summary Statistics tool outputs a table (BlockGroups_Statistics) containing one row with a field containing the total number of customers. The field name is automatically named SUM_NCustomers by the Summary Statistics tool. The Make Table View tool selects all records from SUM_NCustomers that are less than the value found in the MaxCustomers variable. MaxCustomers is a stand-alone value variable of type Long, created by right-clicking the ModelBuilder window and clicking New Variable. MaxCustomers is used in the Make Table View tool dialog box as a stand-alone variable. In-line variable substitution is used in the Expression parameter by placing the percent signs around the variable name (MaxCustomers).
 |
| The iteration system variable %n% is used to set the expression |
In this model, MaxCustomers has been made a precondition to the Make Table View tool. This precondition is not necessary but is added as a visual aid to make it clear that the Make Table View tool uses the variable for in-line variable substitution. The Expression parameter on the Make Table View tool dialog box selects all records where the sum of all customers is less than the value of MaxCustomers. There will be one record selected from the table if SUM_NCustomers is less than MaxCustomers and zero records selected if SUM_NCustomers is greater than MaxCustomers. If zero records are selected, the total number of customers exceeds MaxCustomers.
 |
| The Make Table View tool properties |
The final piece of the puzzle is the Get Count tool. The Get Count tool simply returns the number of selected rows in the input table. The output variable, Row Count, is a Long, not a Boolean variable, but ModelBuilder can use it as a Boolean because any value greater than zero is considered true. If the Make Table View tool doesn't select any records (because the threshold of MaxCustomers has been crossed), the value of Row Count will be zero and it will evaluate to false. Otherwise, it will evaluate to true. The Row Count variable can be used to control iteration. In the Model Properties dialog box, iteration is set by choosing to Run the Model until This Variable is False and the maximum number of iterations is 99.
The model will iterate until the value of the Row Count variable is less than or equal to zero or until the maximum number of iterations, set at 99 in this example, is reached. The maximum number of iterations acts as a safety valve so that if the model ends up selecting all features without meeting the threshold of MaxCustomers, it will stop after 99 iterations.
Additional Resources
Iterations in ModelBuilder help automate geoprocessing tasks. For more information, see the following resources.
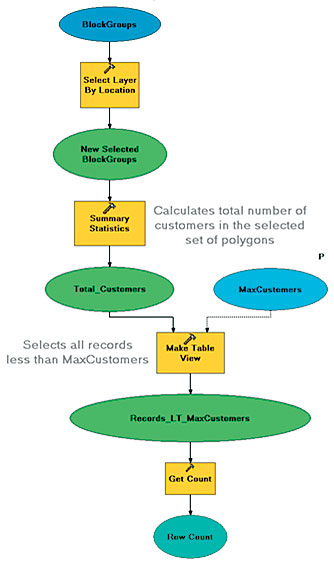 |
| Figure 5: The model selects the adjacent blocks and sums the number of customers. When the number of customers exceeds the maximum number of customers, the model stops. |
|