Esri Announces Winners of the Esri UC Map Gallery Competition
There has never been a more exciting time to make maps, given that they are everywhere nowadays—online, in mobile apps, and embedded in other devices and technologies. They also guide many of our important decisions.
To celebrate the ubiquitous nature of maps, Esri technology users are annually invited to share their best work at the Esri User Conference (Esri UC) Map Gallery. This year, more than 800 maps were submitted for inclusion in the Map Gallery. Of these, 725 were entered into the map competition, which was judged by Esri staff from the development team.

First Place: ArcGIS Pro Map
Gentofte Kommune, a municipality in Denmark, won first place in this category. By using ArcGIS Pro to perform 2D and 3D space-time analysis of emerging population hot spots, city planners were able to better plan for future demographic shifts.
First Place: Story Map
Direct Relief, a nonprofit organization, won for a story map called A Day in the Life, which chronicled 24 hours in the life of community health workers. Like all good story maps, this one had a compelling topic, great photos, informative maps, and the right template/layout to tell the story.
First Place: Student Map Ages 13–18
Emily Faughnan, from Sayville High School in New York, won for her geospatial analysis of missing and exploited children in the New England and New York metropolitan regions. Her entry made great use of maps, charts, and text to explain a complex social issue.
First Place: Student Map—Post Secondary/University/Postgrad
Kevin McMahon, from Community College of Baltimore County, won his award for mapping the movement of refugees in the Syrian conflict. Rather than stick with a single map scale, McMahon depicted and wove together three complex stories about the displacement of refugees in Syria.
First Place—Analytic Map
GSI Environmental Inc. won for its linked modeling and depiction of surface and groundwater processes (which are usually modeled separately). The 2D and 3D maps, along with the detailed time series charts, provided a great way to engage viewers and lead them through what might otherwise be an overwhelming topic.
First Place—Large-Format Print
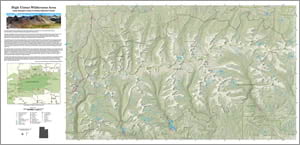
The US Department of Agriculture Forest Service won for the organization’s beautiful reference map of the High Uintas Wilderness area in Utah. The map depicts a majestic and unique landscape and draws viewers in with a clean aesthetic and balanced choice of hillshading and terrain color.

First Place: Small-Format Print
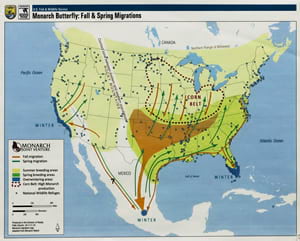
US Fish and Wildlife Service won for its map showing the spring and fall migrations of the monarch butterfly. Staff skillfully made use of the small space available with unambiguous symbology, colors reminiscent of the butterflies, and directional arrows to show the life cycle of this amazing creature.
First Place: Map Series or Atlas
This award went to the University of Wyoming for its Wyoming Student Atlas [PDF]. Like all good atlases, this one constructs a narrative arc, with stories and maps about Native American tribes, major crops, oil and gas resources, emigrant trails, landmarks and forts, election patterns, Wyoming’s Western heritage, and more.
First Place: Most Unique Map
Sacramento County, California, won for its map depicting where 1,000 influential people were born and died. They included famous artists, religious figures, scientists, military persons, and politicians. The map shows that while some of these individuals lived their entire lives in a single town, others traveled the world.
From the winners listed above, the judges chose the overall winner for Best Cartography. The honor went to Andrew Keske of the USDA Forest Service for his map, High Uintas Wilderness Area. The judges thought the map was both a work of art and a great example of scientific mapmaking. The stunning photorealistic textures, hilllshading, and natural features are beautiful but never upstage the data or make the map unusable. The balance of beauty and utility of the map greatly impressed the judges.
To see all the winning maps and the names of the authors and their organizations, visit the 2015 Map Gallery Results web page.

See You in the Map Gallery Next Year
Do you want to show your map in the Map Gallery at the 2016 Esri UC? Anyone who registers for and attends the conference is eligible. The only requirement: you must stand next to your map and answer questions about it for at least one hour during the Map Gallery Opening and Evening Reception, on June 27, 2016.
Esri UC will be held at the San Diego Convention Center from June 27 to July 1, 2016. Details about submitting maps for the Map Gallery will be available closer to conference time at esri.com/esriuc.

