Web maps can transform subjects such as geography, history, and civics from long reading assignments into visual learning experiences.
Students can use online geographic information systems (GIS) mapping technology to investigate a multitude of environmental, historical, economic, and other topics. Using today’s web mapping tools, such as Esri ArcGIS Online, students can research issues, compare data, and analyze patterns using maps that they create and modify.
These eight activities will give you examples of how web mapping and spatial analysis can enrich social studies, including geography, history, economics, and civics.
Geography
Students can use web maps to learn about the dynamics of the planet, including changes in land use, demographics, and the climate. They learn why the scale that a problem is studied at makes a difference in understanding and solving the problem. They also gain a deeper understanding of Earth’s large, interconnected systems, such as the carbon cycle, the circulation of the oceans and atmosphere, and the water cycle. For example, this map helps them to learn the fundamentals of plate tectonics by investigating the types and locations of plate boundaries, earthquakes, and volcanoes.
Questions related to cultural geography can be answered, too. Students can analyze food expenditures per capita at multiple scales using this web map and answer questions such as the following: Why do food expenditures vary? What physical and cultural phenomena influence where people eat? And why do these influences vary across space and at different scales?

History
Web mapping brings historical events to life, as is illustrated by this activity and map depicting the story of an Inuit woman named Ada Blackjack, the sole survivor of a 1921 expedition to Wrangell Island in the Arctic.
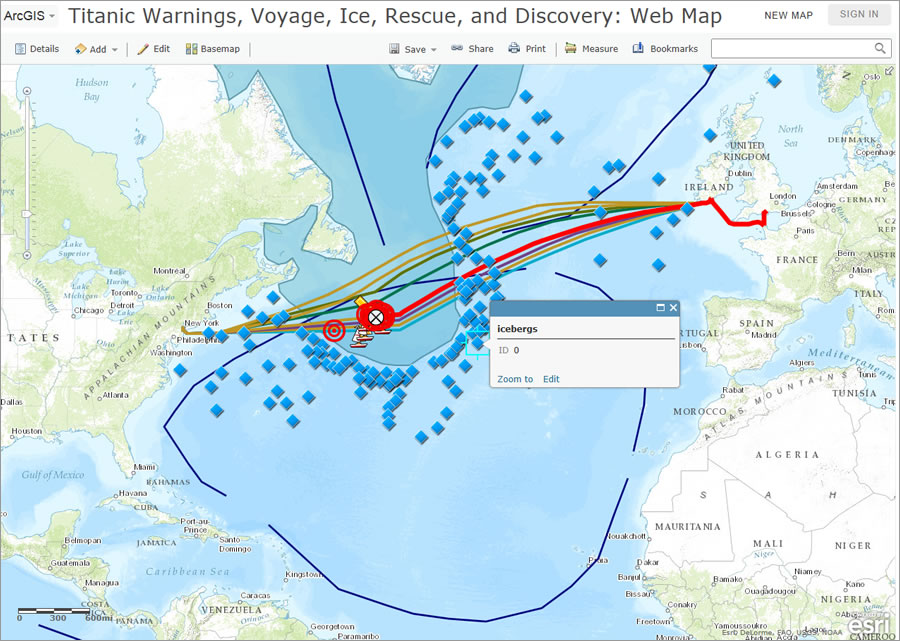
Students also can use web maps to learn more about the RMS Titanic, the passenger vessel that sank in the Atlantic Ocean in 1912. Students can analyze information about the Titanic‘s route, ice warnings, rescue ships, and eventual discovery in 1985 using a series of layers inside this map, which was created on the 100th anniversary of the sinking of the ship.
Economics
Investigating World Bank data in ArcGIS Online helps students to better understand some basic economics, including gross domestic product (GDP), the labor force participation rate, and trade balances.
Examining this map of agriculture, GDP, life expectancy, median age, growth rate, and other variables, allows these factors and the forces behind them to be analyzed in space and over time (note that the time slider bar under the map lets you analyze data from the 1950s to the present). You can use the map to answer questions: What climate, soil, land-use policies, economic variables, and social factors influence the pattern of agricultural land use that you see? What is the relationship between median age and growth rate? Why have some countries experienced stagnation in life expectancy advances for many years?
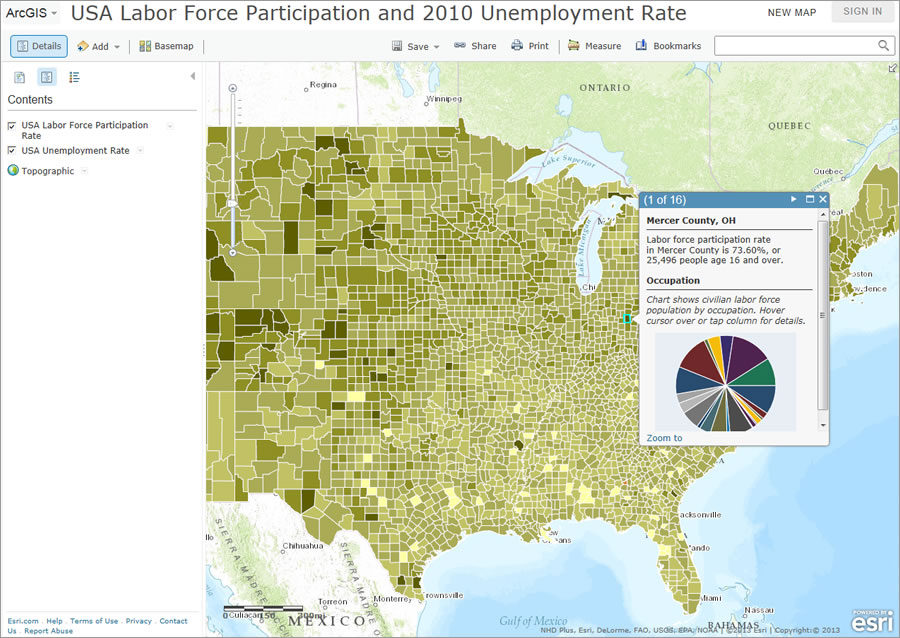
At a more detailed level, you can examine this map, which shows labor force participation rates and unemployment. It invites questions such as, What is labor force participation, Why does it vary, and What is the relationship between it and the unemployment rate? The map can be used to investigate the economics of employment from the state level down to the block group level using live maps and detailed pie charts.

Civics
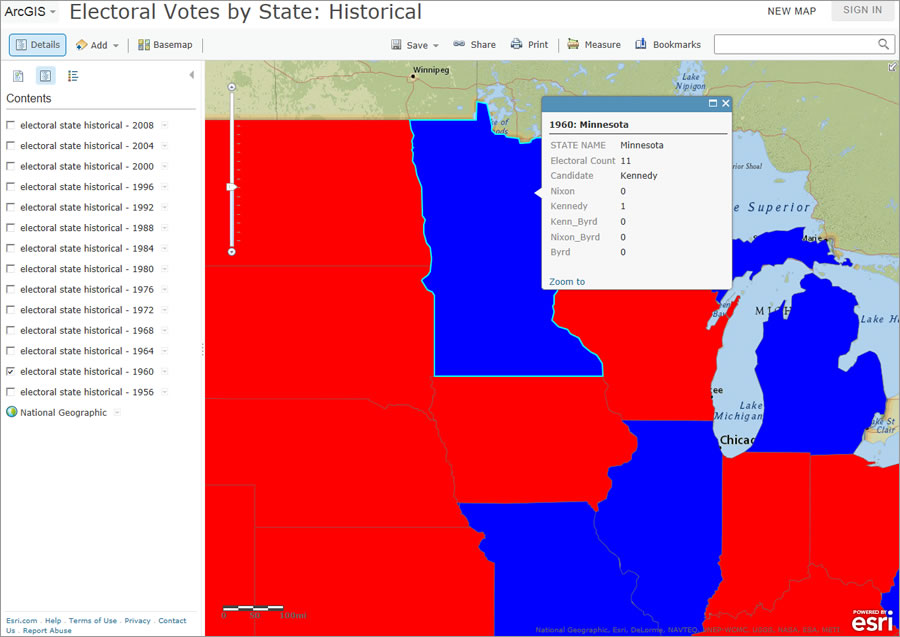
Students can examine electoral votes by state going back to the 1956 presidential election. How have states’ patterns of voting for Democratic or Republican candidates changed or stayed the same over time? Over the past 50 years, which election was the closest based on the number of electoral votes? Which election was the most one-sided? How has the state where you live voted over time? How has the number of electors in each state changed over time and why? If you were a candidate, where would you spend most of your time campaigning today versus in 1956? What are the “swing” or battleground states, and how have the voters there cast their ballots recently?
ArcGIS Online
Esri ArcGIS Online includes powerful, easy-to-use, web-based tools that students and educators can use to create, save, and share their own customized maps on an infinite variety of topics and scales, all using a standard web browser.
You can do each of the activities described in this article using a free subscription to ArcGIS Online. The content available ranges greatly—population, natural hazards, land use, agriculture, and more. Data can be compared in many ways, such as using side-by-side maps, altering transparency or symbology, and analyzing tabular databases.
For more rigorous analyses with additional tools, Esri offers ArcGIS for Desktop software and organizational subscriptions to ArcGIS Online. Obtain a free 30-day trial to ArcGIS Online. You can also try ArcGIS for Desktop free for 60 days.
Digging Deeper
Curious and want to learn more? Click these links for additional resources:

