ArcGIS Earth is a free, powerful, desktop-based interactive globe used to visualize the earth in 3D. ArcGIS Earth runs via a program that you install on your computer, works with Windows 7 and above, and accesses spatial data over the web.
Teachers who want to use ArcGIS Earth in their classrooms can add data that they or their students create, or data that local, regional, national, and international organizations have created, in a wide variety of themes: natural hazards, demographics, hydrography, ecoregions, energy, health, and much more.
Because ArcGIS Earth can access data from ArcGIS Online, the number of layers available is vast, and expanding daily. Educators and students can also visualize data collected and stored on their own computers. Let’s explore five activities that teachers and students can quickly and easily use in the classroom, at a wide variety of educational levels and disciplines.
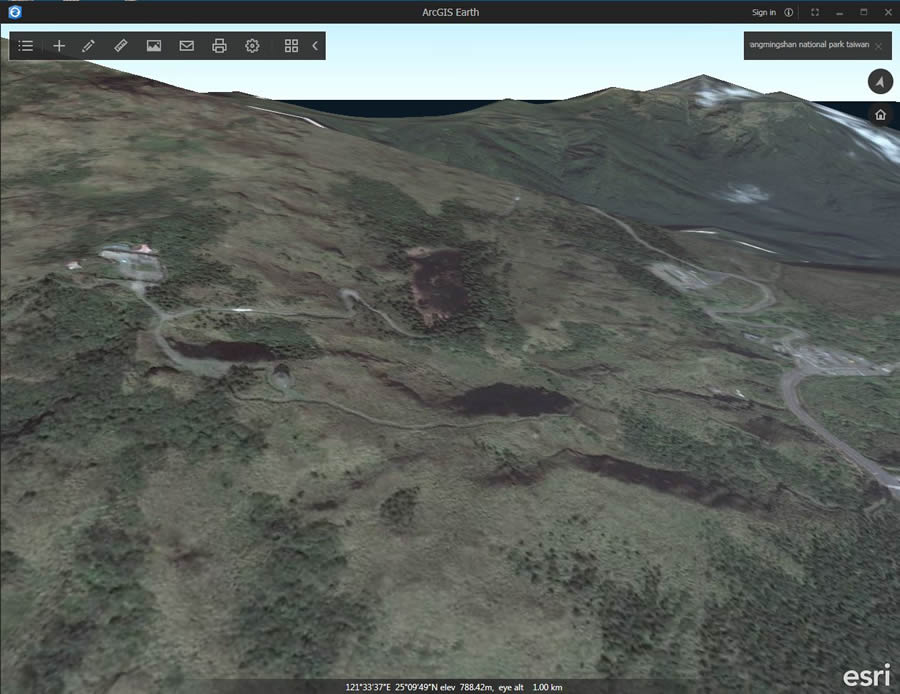
- Study your community or region or other geographic areas around the world by using satellite imagery. For example, students can virtually explore Yangmingshan National Park in Taiwan, which contains sulfur deposits, fumaroles, venomous snakes, and at least 20 volcanoes. ArcGIS Earth can be used to teach about the physical geography of the park, shown, in part, below.
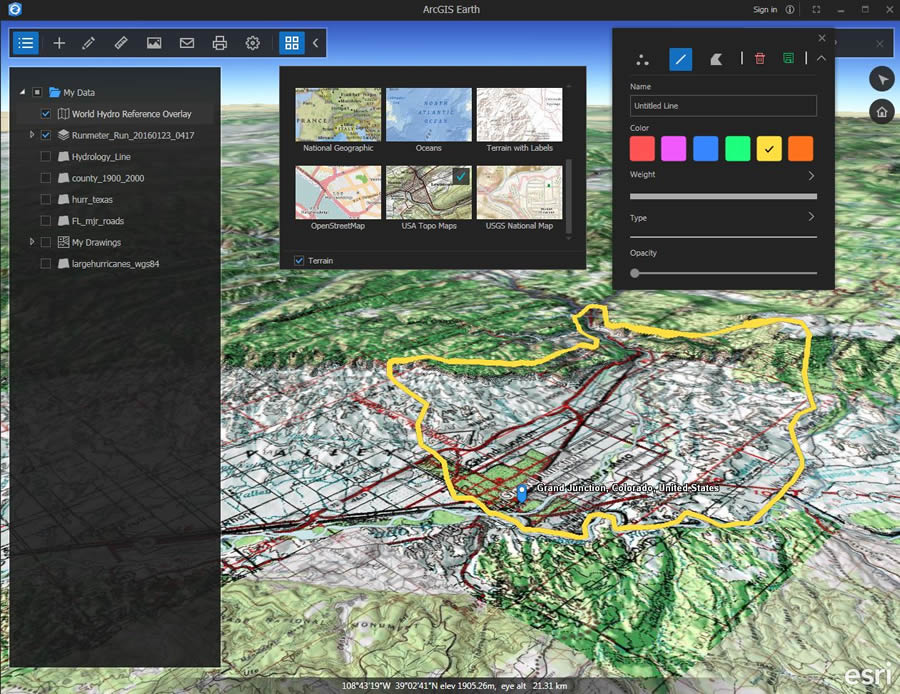
2. Teach students about watersheds. Students can add the World Hydro Reference overlay to ArcGIS Earth, change the current basemap to a topographic basemap, and highlight the boundary of a watershed in western Colorado. Using the technique illustrated below, students can be taught the relationship between watersheds, river drainage, and topography.
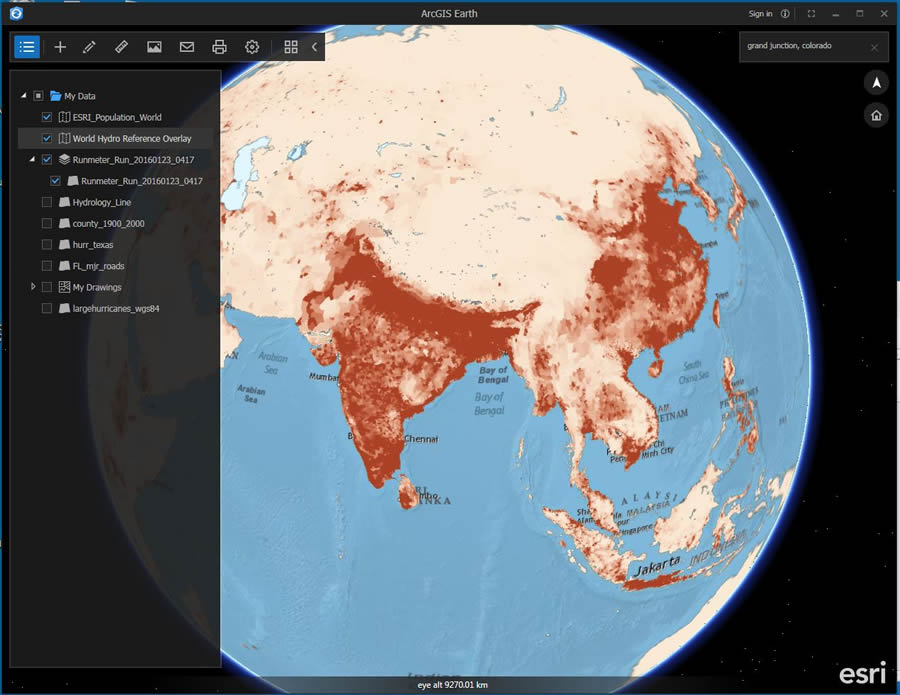
3. Investigate population density and world demographics. Below, the world population density layer was added to ArcGIS Earth. Demographic data can be added by country, location of major world cities, and other map layers to teach about world settlement patterns and why they are important.
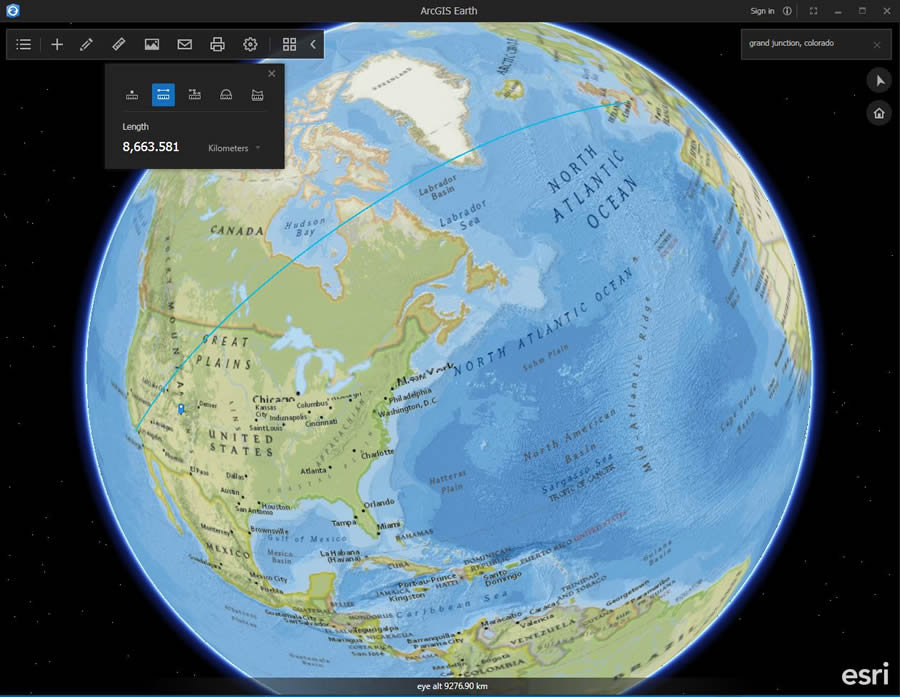
4. Teach about the shape and size of the earth. Using the measurement tool in the example below, educators can show students the great circle routes and teach much more about distances and the physical geography of the earth.
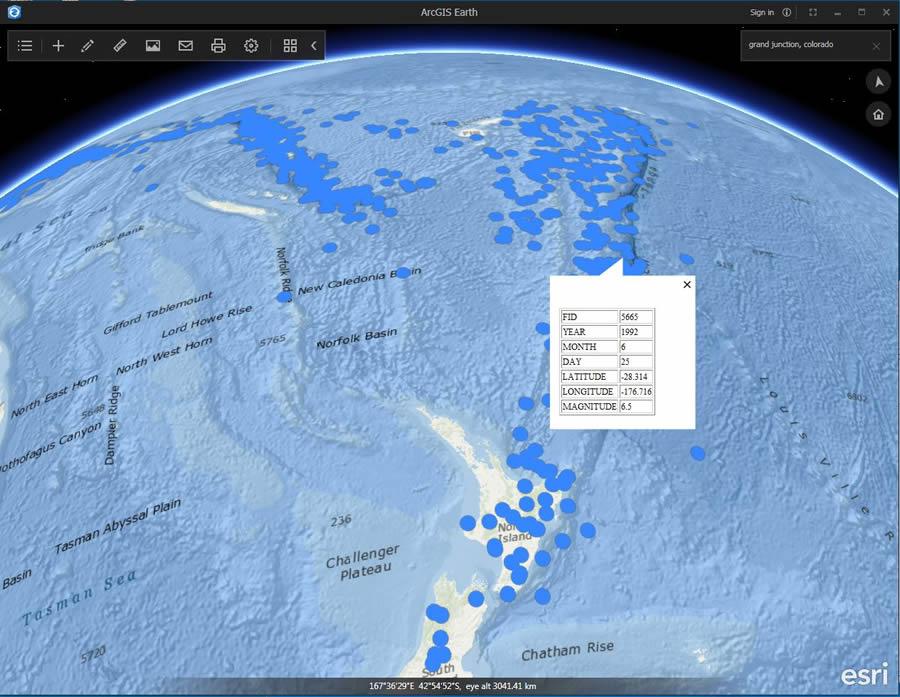
5. Study real-time data. In the example below, the oceans basemap and earthquake data from the last 90 days are being used to study the relationship between tectonic activity and the ocean trench northeast of New Zealand.
Much more can be done, but these examples illustrate how ArcGIS Earth can be used in classes and for research.
Learn more about ArcGIS in education.
