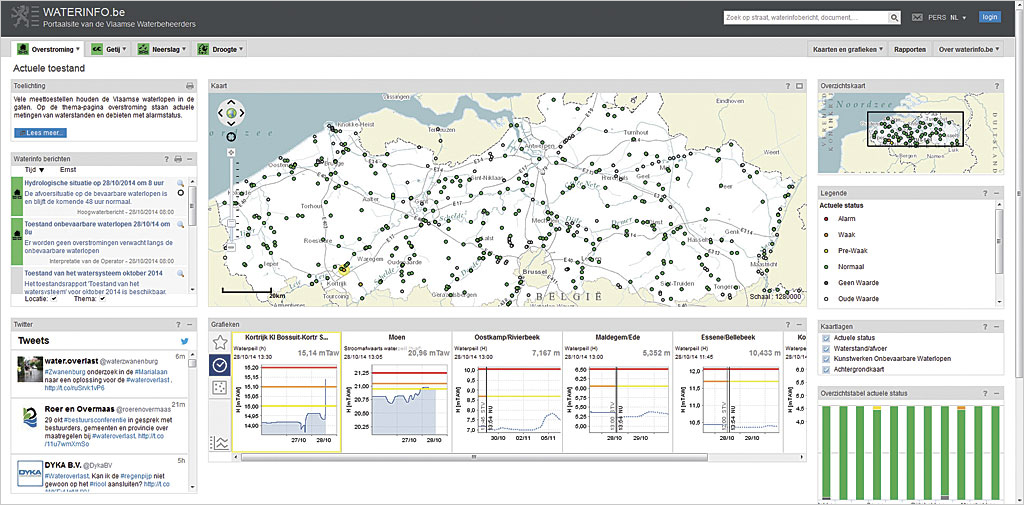
The environmental agency in Flanders has built an advanced flood forecasting system that uses real-time measurements and meteorological forecasts as input for hydrologic models. The real-time flood forecast maps it publishes using ArcGIS for Server keep residents aware of potential danger by showing the maximum extent and impact of flooding.
Located in the Low Countries of northwestern Europe, Belgium—particularly Flanders, a region in Belgium—has historically suffered from flooding. Records indicate that major storm surges between the thirteenth and seventeenth centuries destroyed more than 100 coastal villages in the region. Portions of Flanders are at or below sea level and contain a dense network of rivers that increase the potential for flooding during periods of heavy rainfall and storm surges.
Over the years, the Flemish government has implemented flood control projects, including a comprehensive dike and canal system, in an effort to protect the region. However, as a result of massive floods in 1998, when the Demer River overflowed its banks and caused severe damage, the government began exploring methods of flood prediction.
“We began building a simple forecasting system for the Demer River in 2002,” said Kris Cauwenberghs, head of the flood management unit of the Flanders Environment Agency, or Vlaamse Milieumaatschappij (VMM). “The system generated predicted stream discharge hydrographs showing the variation of water discharge over time.” The modeled Demer River is about 100 kilometers in length, and the hydrographs were only used for internal purposes at that time.
Since then, the VMM has developed and deployed an advanced flood forecasting system throughout Flanders that monitors more than 4,000 kilometers of the region’s waterways. To publish the flood forecast on the web, VMM used ArcGIS for Server Enterprise Advanced as well as ArcGIS Image Extension for Server, ArcGIS Spatial Analyst for Server, and ArcGIS 3D Analyst for Server. This software stack is used to manage, analyze, and serve the massive amounts of data collected by the flood forecasting system.

To fully comprehend the dynamics of the waterways in Flanders, surveyors have spent the past 15 years extensively mapping them by creating cross-sections of the rivers every 50 meters. The data collected includes detailed information on the profile of the riverbed and riverbanks as well as the dimensions of bridges, locks, water reservoirs, and other infrastructure along the waterways. This data is included in the forecasting system for monitoring and flood assessment purposes.
Real-time measurements are taken every 15 minutes and, together with meteorological forecasts, are used as input for hydrologic models. The hydrologic models in the flood forecasting systems are used to predict the volume of the water discharge during a specific period of time. The outputs from the hydrologic models are also used to feed the VMM’s hydrodynamic models. This data is seamlessly merged with data from other Flemish organizations for advanced impact analysis and then shared with those agencies responsible for water management and emergency planning.
“Originally, we used deterministic forecasting for our predictions,” said Cauwenberghs. This early flood-modeling procedure was based on analyzing existing conditions and single meteorological forecasts. Today, the VMM uses ensemble forecasting. This type of forecasting employs a methodology based on repeated random samplings of water levels, flows, and precipitation to produce hydrodynamic models for the prediction of potential flooding outcomes. “Ensemble forecasting allows us to deliver flood forecasts 10 days in advance, and VMM can now confidently publish its real-time flood forecast maps to keep its residents aware of potential danger,” concluded Cauwenberghs.
The resultant flood maps can be used not only for evaluating the predicted maximum flood extent but also for determining the impact of a potential flood, such as which houses and streets will be flooded, so that precautionary measures can be taken.
To identify flood-prone areas, the VMM creates simulations by combining its hydrodynamic models with a digital elevation model and the river cross-sections and related infrastructure mapped by the surveyors. These simulations mimic the physical characteristics of a waterway by imitating how water flows through a specified riverbed. This provides a comprehensive overview of the entire river and facilitates a highly accurate prediction of the extent of flooding when a river overflows its banks. The model is calibrated using data collected from the historical storms that have struck the region.
“Using the same hydrodynamic models, we can also produce flood hazard maps in an offline mode for insurance risk purposes,” said Cauwenberghs. “Instead of the actual flood extent, these maps show the probability of flooding based upon statistical analysis and can be used for spatial planning purposes or insurance risk calculations.”
To explore the Flanders environmental agency’s flood forecasting system, visit www.waterinfo.be.

