This tutorial is the logical sequel to “Unlocking Data Trapped in paper: Address geocoding legacy geological data” in the Fall 2011 issue of ArcUser. That article introduced a method for geocoding legacy point data originally collected along locally defined survey lines. This article provides methods for managing locally defined raster, vector, and computer-aided drafting/design (CAD) data in projected systems. It uses tools available in ArcGIS 10.1 to create a simplified workflow for georeferencing a scanned image and a CAD drawing.

Getting Started: Back to Battle Mountain
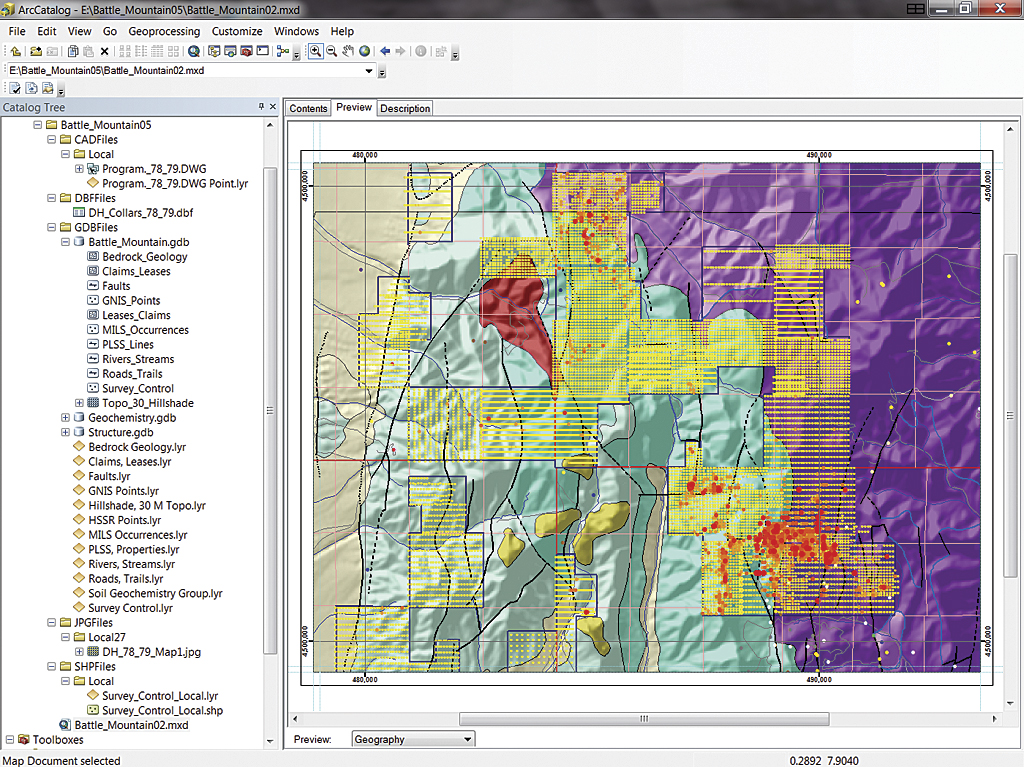
Download the sample dataset [ZIP]. Unzip the data locally. Like previous exercises, this exercise uses data from Battle Mountain, Nevada. The folder generated when the archive is unzipped is named Battle_Mountain05 to protect earlier work you may have done in this series. Start ArcCatalog, navigate to the Battle_Mountain05 folder, and inspect the data. Note that the subfolders CADFiles, JPGFiles, and SHPFiles contain a subfolder called Local. Preview the Battle_Mountain02.mxd file, which contains soil and rock geochemical points that were added in a previous exercise.
Legacy Programs, Legacy Maps
Close ArcCatalog, start ArcMap, and open Battle_Mountain 02.mxd. Zoom to the Anomalous Soils 1:20,000 bookmark. Notice the intense surface gold anomaly. This anomaly occurs on the Old Rattler Claims. During recent sampling, we noticed several old marked drill holes and many old reclaimed drill pads. Investigation revealed that this mineralized area was first identified back in the 1970s by field mapping, sampling, and shallow drilling. We also found a drill hole collar file that includes the drill hole name, date, coordinates, depth, and inclination for more than 80 holes drilled in 1978 and 1979. Let’s bring this data into the project. Save the project as Battle_Mountain05.
In the table of contents (TOC), collapse and turn off the Soil Geochemistry group. Click the Add Data button, navigate to \Battle_Mountain05\GDBFiles and add two Layer files: Claims, Leases and Survey Control. Maplex Label Engine is now available to all ArcGIS 10.1 users regardless of license level, so answer Yes if prompted to use the Maplex Label Engine. If necessary, update any broken data links. Save the project again to register Maplex for it. Zoom to the extent of the Survey Control layer and review the map.
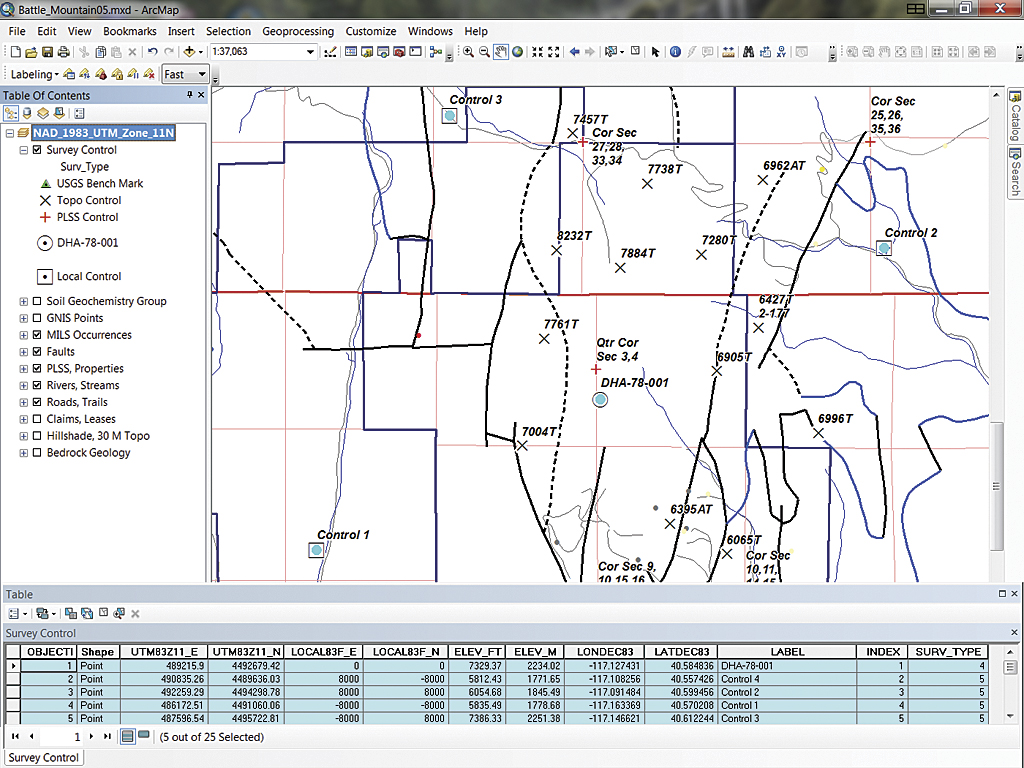
Select the Survey Control layer. This data, carefully collected by our own surveyor, will be the key to posting early data on the map. These GPS survey points were captured in decimal degrees using the World Geodetic System 1984 (WGS84) datum that has been reprojected to universal transverse Mercator (UTM) North American Datum 1983 (NAD83) Zone 11 for this project. Open the attribute table for the Survey Control layer and observe that it also contains some local coordinate data and some decimal degree coordinates. Select records with [SURV_TYPE] = 4 or 5. Close the attribute table and use the Anomalous Soil 1:50,000 bookmark to zoom out.
The control survey data includes US Geological Survey benchmarks, hilltop survey stations, Public Land Survey System (PLSS) corners, and several special field points captured from the 1978 and 1979 drilling program. Notice that [SURV_TYPE] = 4 is a single drill hole collar representing DHA-78-001, the first hole drilled in the area. This hole marks the origin (0,0) of the local Old Rattler Grid. [SURV_TYPE] = 4 represents early line control on orthogonal lines 8,000 feet from the center. Notice that these points, labeled Control 1 through 4, appear to be rotated clockwise approximately 15 degrees. Coincidentally, magnetic declination in the late 1970s was approximately 17 degrees around Battle Mountain. [Magnetic declination is the difference between north (as indicated by a compass) and true north (the direction to the north pole along the earth’s surface)]. What do you think happened? Remember, not all early compasses allowed a user to set declination.
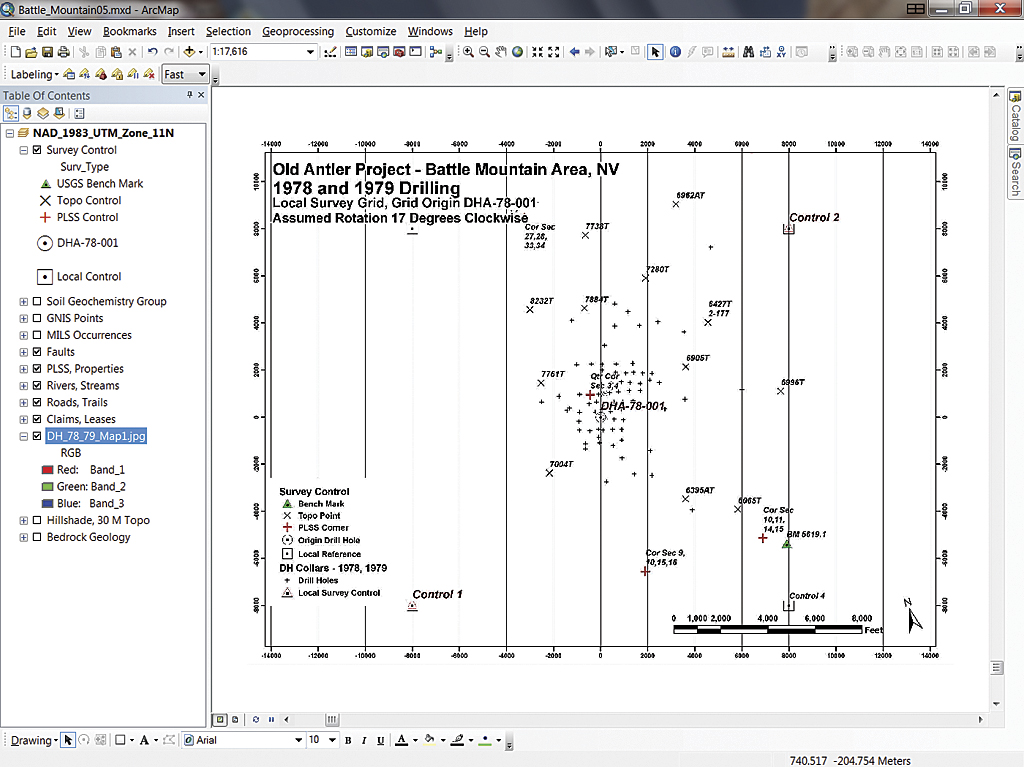
The 1978–79 drilling and survey map was scanned and is stored as DH_78_79_Map1 in \JPGFiles\Local\. Add it to the map. Click OK to create pyramids of this raster and OK again to dismiss the warning that it has an unknown spatial reference. Because it is not georeferenced, DH_78_79_Map1 will not appear near Battle Mountain. Click on the layer and choose Zoom to Layer. DHA-87-001 is located at the grid origin, and the four control points are located on 8,000-foot grid intersections. Look at the north arrow. Geographic north appears to be rotated counterclockwise about 15 degrees. Now to georeference this scanned map to look at drill hole collars at Old Rattler. Zoom to Previous, turn off the Bedrock Geology; Hillshade; and Claims, Leases layers and save the project.
Georeferencing a Legacy Map
Now to register the scanned map and a CAD drawing file in the project’s UTM coordinate system using the ArcGIS 10.1 Georeferencing toolbar. The surveyed control layer will be essential for this task. Load the Georeferencing toolbar by right-clicking anywhere in the open toolbar area and selecting Georeferencing. Dock this toolbar, choose DH-79-79_Map1.jpg as the active Georeferencing layer, and save again.
Make sure DH-79-79_Map1.jpg is near the bottom of the TOC layers. Zoom to the extent of the Survey Control layer, click the Georeferencing drop-down, click Fit to Display, and leave Auto Adjust on.
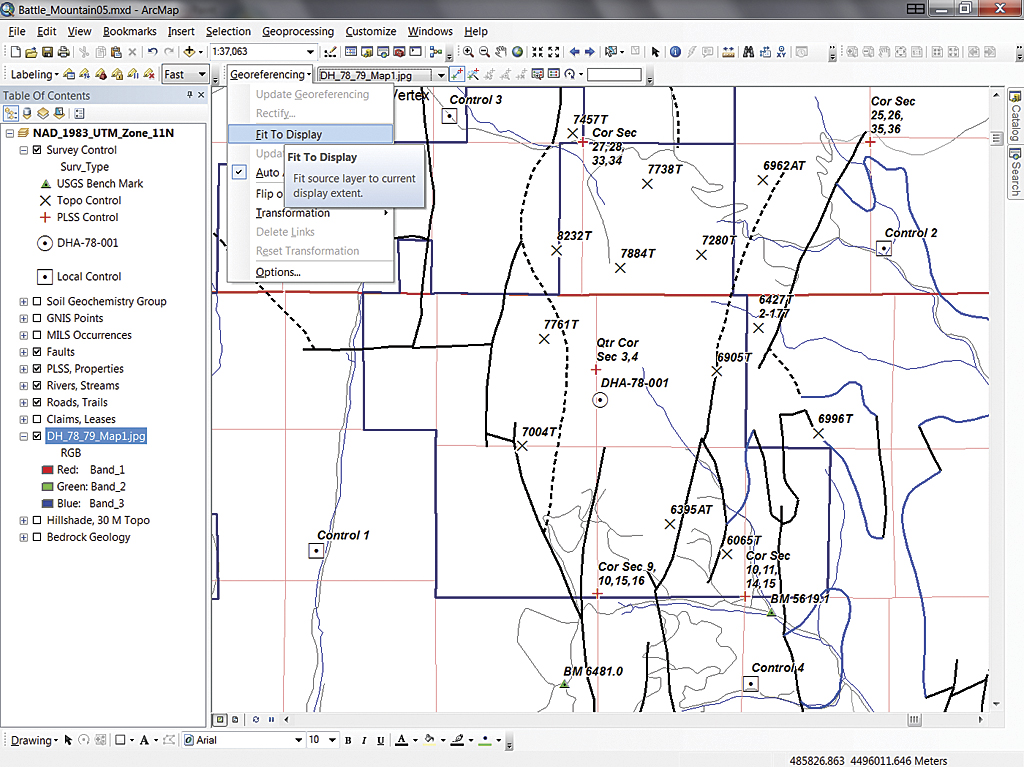
Start up in the northeast corner with Control 2. At this scale, it is hard to distinguish the control points, so zoom in closely to both the Control 2 points displayed. Control 2 on the scanned map now has a very large symbol and label, while survey point Control 2 appears much smaller.
Click the Add Control Points button from the Georeferencing toolbar. Hover over the center of Control 2 on the raster and left-click, then move the cursor to surveyed Control 2 and click it.
The raster layer will be repositioned. This is new in ArcGIS 10.1. If the snapping setting will not allow you to pick the exact center of the raster point, momentarily press the space bar to override snapping. The Control 2 points on the raster and the survey layer should be connected.
Zoom back to the extent of the Survey Control layer and zoom in to the southwest to the locations for both Control 1 points. Link these two control points. To more easily see the vector point, momentarily turn off the raster. As you create the link for Control 1, watch the scanned map rotate into place. In the CAD world, this two-point registration would be termed a Rotate-Scale-Move procedure. These terms will turn up again, so remember them.
This time, zoom to the extent of DH_78_79_Map1.jpg. If it looks reasonable, save the project to preserve this preliminary registration.
Continue linking the control points for Control 3 and Control 4 in the same manner. Be sure to link points even if they appear to be very close without being linked. Zoom way in and use the space bar to override snapping when linking to the raster point, if necessary.
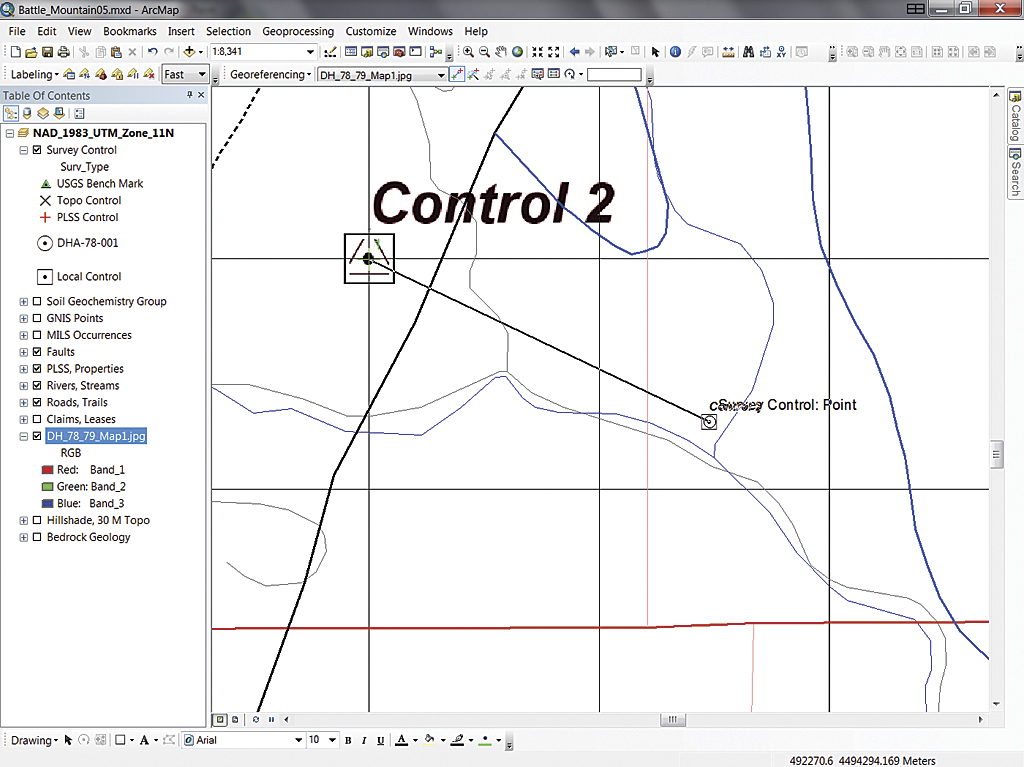
Finally, zoom to the local origin at DHA-78-001 and link that point on the scanned map to the vector point.
Inspecting the Link Table and Updating Georeferencing
On the Georeferencing toolbar, click the Open Link Table button, stretch the table so all columns are visible, and check the links just created. Inspect each link’s residual value and note the Total RMS Error. A total error of less than 5.0 feet (or approximately half the scanned pixel size) is considered acceptable. You can link other control points. With a bit of extra care, the Total RMS might drop below 0.10. The new Link Table tools in ArcGIS 10.1 are a bit different than in previous versions.
Finally, let’s update the georeferencing. Zoom to DH_78_79_Map1 and click the Georeferencing drop-down from the Georeferencing toolbar. There is a choice to Rectify the scanned map. This choice creates a brand new graphic object with modified pixels and blended colors in a new coordinate system.
Because the map is so close, an updating is all that is needed. From the drop-down, choose Update Georeferencing and watch as the control point symbols disappear. If you reopen the Link Table, the control points will reappear (also a new feature). Save your project. In the background, ArcGIS just created several auxiliary and reference files that will always load this scanned map into UTM NAD83 Zone 11.
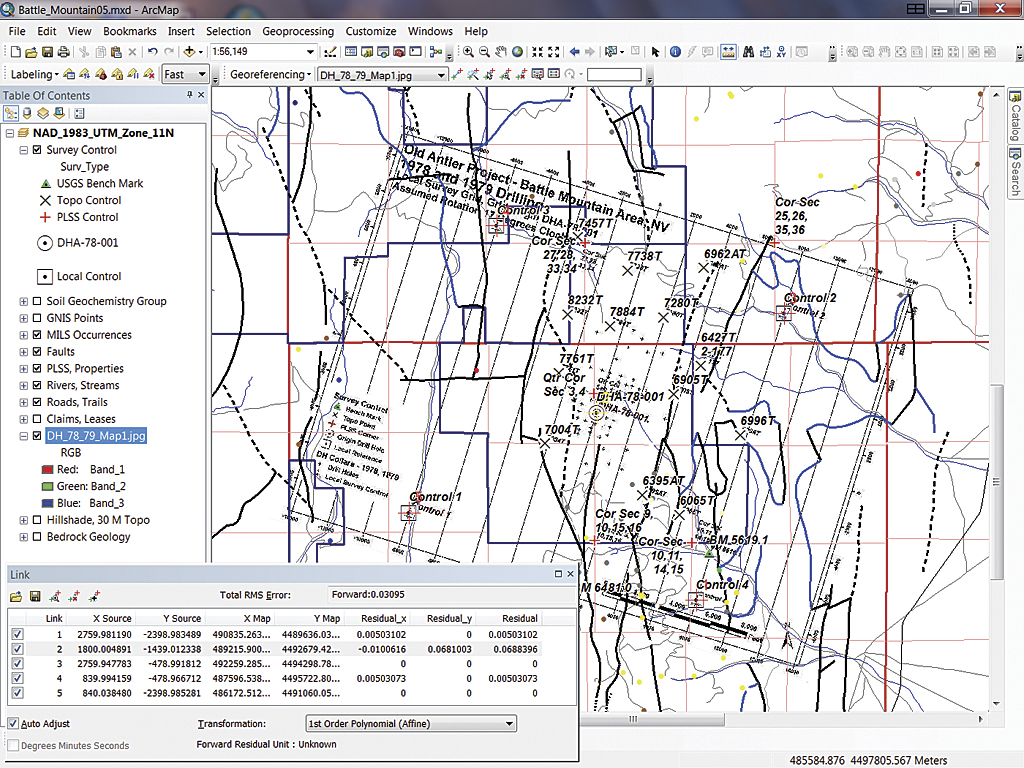
With the local grid map georeferenced, the locations of the 1978 and 1979 drill hole collars now appear as small tics on the map. These locations and points could be captured in an attempt to determine each drill hole’s ID. Instead, let’s post these collars as vector points using a different method.
Loading and Georeferencing a CAD Drawing
In the early days of field surveying and CAD drafting, many projects like the one that generated the 1978–79 drilling collar data were deployed. A central point was established, typically with coordinates 0,0, and other locations were measured along x and y axes extending from this origin. Many times, these axes were rotated to follow geologic structure or possibly point toward magnetic north. A CAD drawing file containing both the survey points and drill hole collars has been uncovered, and it appears several CAD layers and the drawing are registered in the same local coordinate system as the scanned map. Loading the drawing file will test that theory.
CAD in a Map
Zoom back to the extent of the Survey Control layer and click Add Data. Navigate to \CADFiles\Local and observe the CAD feature dataset and its Layer file. If you are curious, expand the CAD dataset and notice the other entity types and defined CAD point feature classes (DH Collars, Local Control, and Other Control). These special classes, exposed by the ArcGIS CAD model, can be loaded individually or in groups.
In this case, load the single Layer file that supplies predefined point symbology for the CAD data. Select and add Program_78_79.DWG. Answer OK when notified that the data does not include a spatial reference.
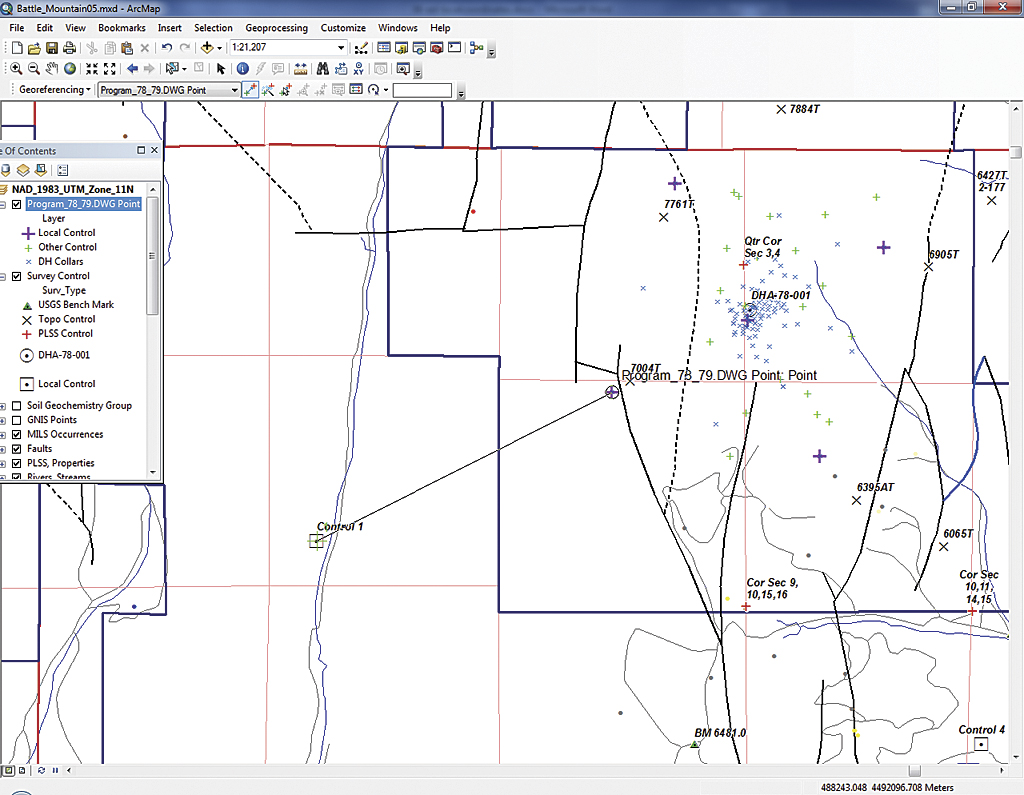
In the TOC, position the CAD points above the Survey Control layer. Select the CAD points layer and choose Zoom to Layer. Notice the range of coordinates and hover the cursor over the red crosshairs to confirm that they represent the survey control used earlier to georeference the scanned map. To make the red cross symbols more easily visible, change their color to purple.
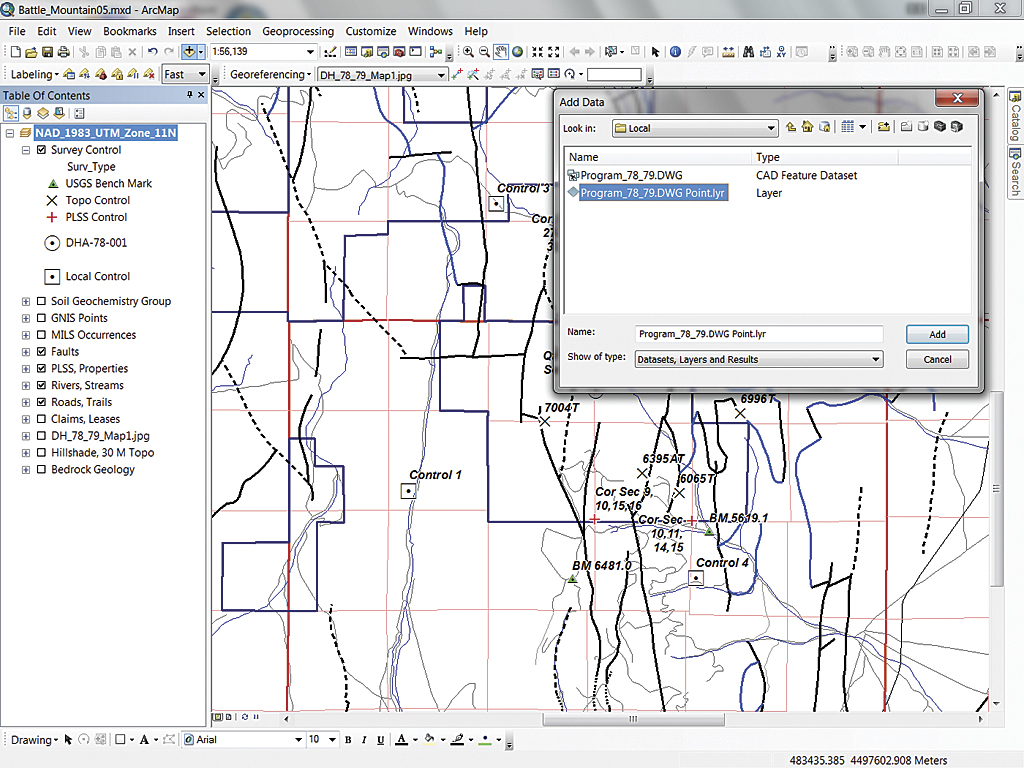
The Georeferencing tools can now be used to fit this CAD data into the Battle Mountain project. In the toolbar, identify Program_78_79.DWG Point as the layer to be georeferenced. Once this file is correctly positioned, the resultant CAD world file can be assigned to other CAD files (both DWG and DXF) without individually referencing each file.
Zoom back to the extent of the Survey Control layer, click the Georeferencing drop-down, select Fit to Display, and watch the drawing file appear. Do you see the purple cross symbols for Control 1 through 4 and the central drill hole origin? This time, let’s start linking control points with Control 1 first and finish with Control 2.
Two-Point CAD Registration—The Real Rotate, Scale, and Move
Standard CAD registration is limited to two control points. For maximum effect, these points should be located diagonally across the area. Also, if the CAD data is in the same conic projection and the destination data, distortion in areas that are not on the selected diagonal will be minimal. Bottom line: this method works great for some CAD files and not so well for others.
Zoom to the raster Control 1 point in the southwest. Use the Identify tool to learn the feature ID (FID) for the nearest purple cross. It should be FID 4.
Click the Add Control Points tool and create a connection between the purple cross symbol and Control 1. Resist the temptation to open the Georeferencing drop-down to apply Auto Adjust—the second point must be set first.
Zoom back out to the extent of the Survey Control layer. Zoom in to the area near Control 2. Use Identify to verify that the nearest purple cross is FID. Create the second tie from the CAD point to the Control 2 point. To cancel a link in the wrong direction that was created accidentally, right-click before placing the link and select Cancel Point. If the link is completed, remove it from the Link Table before continuing.
After placing both points, zoom back to the extent of the Survey Control layer, open the Georeferencing drop-down, and select Auto Adjust. Zoom in to each labeled control point and check the closeness of each. Using the results of careful surveying and snapping to help place points can place these points so they are off by less than 0.01 meters.
Preserving Georeferencing with a CAD World File
By creating a CAD world file, this careful georeferencing can be reused on other files. Click the Georeferencing drop-down and select Update Georeferencing. When the CAD World File dialog box opens, verify that the new file will reside in \CADFiles\Local and accept the name Program_78_79.wld. Later, you can open this file in a text editor to see how it is built.
Finally, select the Identify tool and click any drill hole collar, symbolized as a small blue x. Inspect the Esri CAD model structure and look for fields that might help to assign a drill hole ID to the selected point. The collars are on a layer called DH Collars, but there is not much that can be gleaned from the attribute table. Unfortunately, early CAD shops did not post robust attributes with drawing entities.
Moving Forward
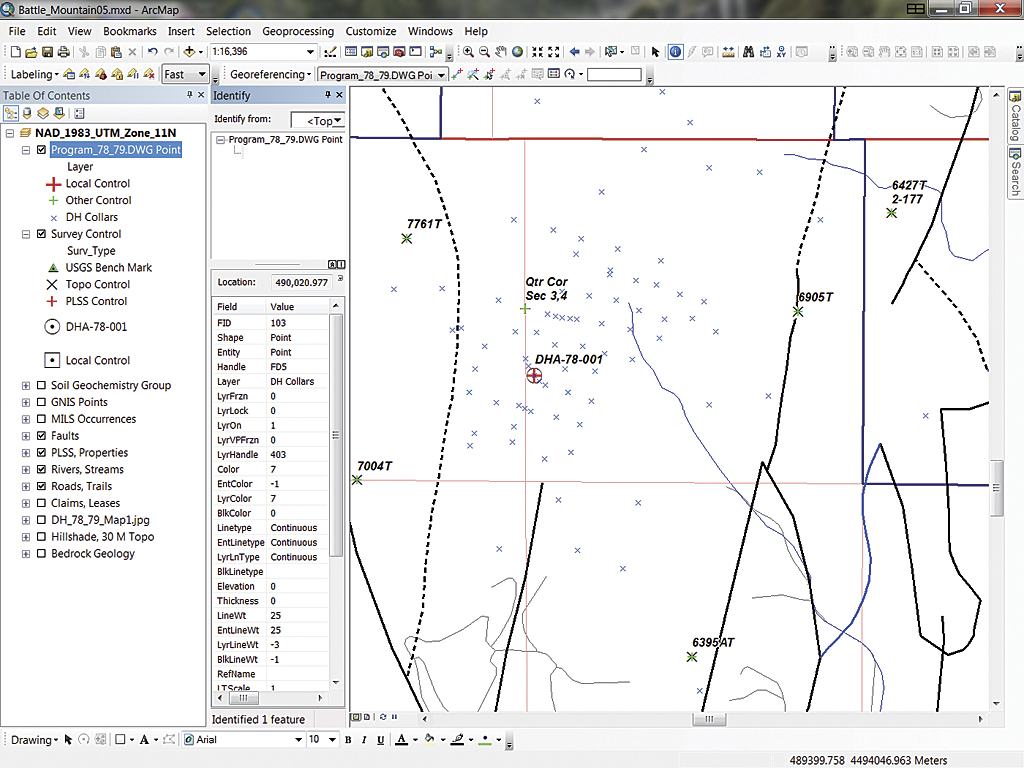
The carefully positioned drill hole collars registered in UTM space using the high quality CAD world file can be used to calculate NAD83 metric coordinates. This generic world file will reference more than the Old Rattler CAD files in the UTM system. To create a universal CAD world file, use a Windows file manager to browse to the folder containing CAD files that are in the same coordinate system. Copy Program_78_79.wld and rename it esri_cad.wld. With this special file in the CADFiles folder, the transformation will be applied to each CAD dataset that does not already have a companion world file.
Summary and Acknowledgments
This exercise uses the same generalized training data used in several previous Battle Mountain training sets. The new data includes completely synthetic drill hole collars and synthetic or topographic survey control. Thanks to Chris Brod and his surveying and mapping students at Bellingham Technical College, Washington, for helping unravel, synthesize, and test data for this tutorial.

