New Zealand Transportation Agency Models Curve Risks on Rural Roads to Save Lives
When it comes to investing in road safety—a primary concern for all governments—the focus is to identify and prioritize projects that will save the most lives and prevent as many serious injuries as possible. Road managers are already using geospatial analysis to identify high-risk roads and prioritize safety projects. These types of analysis are usually reactive in nature, though—relying on crash data to highlight black spots (places where there are clusters of crashes) and reveal crash trends. But as transportation agencies pinpoint and address these hot spots, they can increasingly use smart spatial apps to discern the next problem spot that may not be immediately apparent from looking at crash data alone. A particularly challenging area, however, is low-volume rural roads, where crashes tend to be random and sporadic in nature.
The NZ Transport Agency (NZTA), the government organization responsible for delivering a safe and efficient national transportation infrastructure system in New Zealand, set out to develop a spatial road safety risk assessment methodology that specifically targets these low-volume rural roads. The agency wanted to be able to evaluate the safety of horizontal curves—those gradual turns that connect two adjoining strips of highway—based on a road’s geometric and operating speed features. So Esri partner Abley Transportation Consultants, which specializes in designing and implementing road safety strategies, helped NZTA build a geospatial risk prediction methodology based on the ArcGIS platform.
Categorizing Curves
NZTA had two key requirements for the risk assessment methodology. First, it needed to be created using already-available knowledge of the road network, including existing spatial data and associated transport attributes, such as speed limits. Second, it had to be cost-effective so it could be readily applied across an extensive road network.
Abley based the NZTA’s geospatial risk prediction methodology on a road engineering process that includes driver behavior models for acceleration on straight roads and deceleration on curves along high-speed corridors. The risk assessment process involves comparing approach speeds with the radius, or tightness, of a curve to assign a risk classification to each curve in both directions of travel. This risk classification is a proxy for the likelihood that a driver will lose control while taking the curve.

Abley also included in the methodology the Operating Speed Model from Austroads, the lead organization for Australasian road transportation and traffic agencies. The model is designed to be administered manually on relatively short segments of road—about 10 to 25 kilometers, or 6 to 15 miles.
Here’s how it worked: A traffic engineer would split a road corridor into a series of straights (with known lengths) and curves (with known radii) and then follow a complex methodology to identify maximum desirable speeds based on the overall curvature and terrain profile of the road. The traffic engineer would then assess each element of the road (straight or curve) to determine the start and end operating speeds for each road curve segment by using vehicle acceleration or deceleration models.
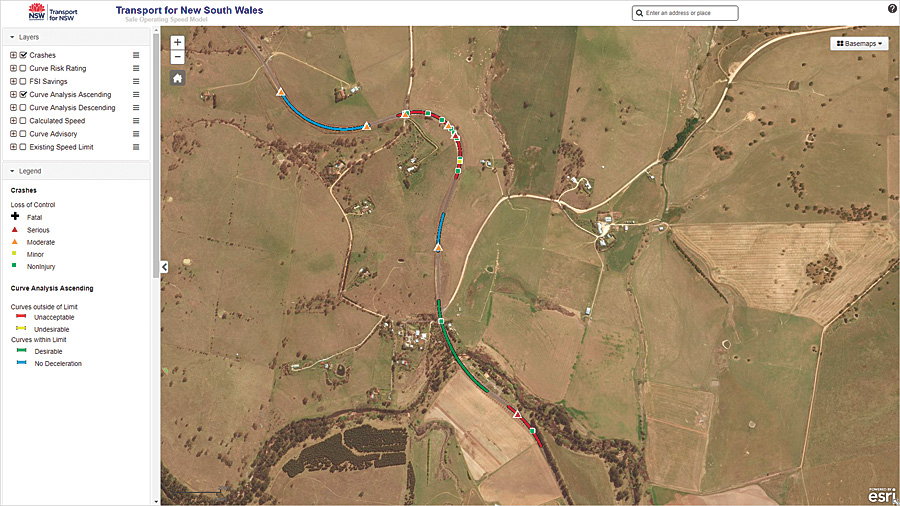
The transportation authority could then categorize curves by comparing the approach speed to the curve radius. Curves where drivers need to decelerate only slightly are considered “desirable” or “within context.” Curves where substantial deceleration is required are classified as either “undesirable” (moderate risk) or “unacceptable” (high risk).
This model works, as there are fewer crashes where it is applied. But to have road authorities manually implement it across all the high-speed roads they manage would be too time-consuming and cost prohibitive. Because the inputs for the speed model are available as a spatial dataset, however, Abley automated the process using ArcGIS Desktop and the available road centerline network.
Assessing and Predicting Risk
Abley developed a number of smart geospatial workflows—including ArcGIS models and Python scripts—to segment road corridors, identify curves, calculate curve radii, predict vehicle operating speeds along corridors, and assess curve risk based on approach speeds and curve radii across the entire high-speed road network.
Using the available road centerline network, the project team employed ArcGIS Desktop to create a process for identifying curves and straights. The process splits the road into 10-meter (32-foot) sections and calculates the curve radius over a 30-meter (98-foot) arc. Individual curves were identified as contiguous sections with a radius of less than 500 meters (1,600 feet), which is what defines a horizontal curve, and a curvature going in the same direction. Abley then modeled maximum desirable operating speeds for each section of road by combining the overall terrain (based on a digital elevation model) and curvature of the road, which ranged from flat and straight (allowing cars to go 110 kilometers per hour, or 68 miles per hour) to mountainous and tortuous (only allowing for speeds of 75 kilometers per hour, or 46 miles per hour).

From there, Abley calculated actual free-flow operating speeds and curve risk by running a Python script in ArcGIS Desktop that sequentially evaluated each element of the road—both curves and straights—to model vehicle speeds and driver behavior. On undivided roads, vehicle operating speed and curve risk is analyzed in each direction, making it possible to identify curves whether the risk to drivers occurs in only one or both directions of travel.
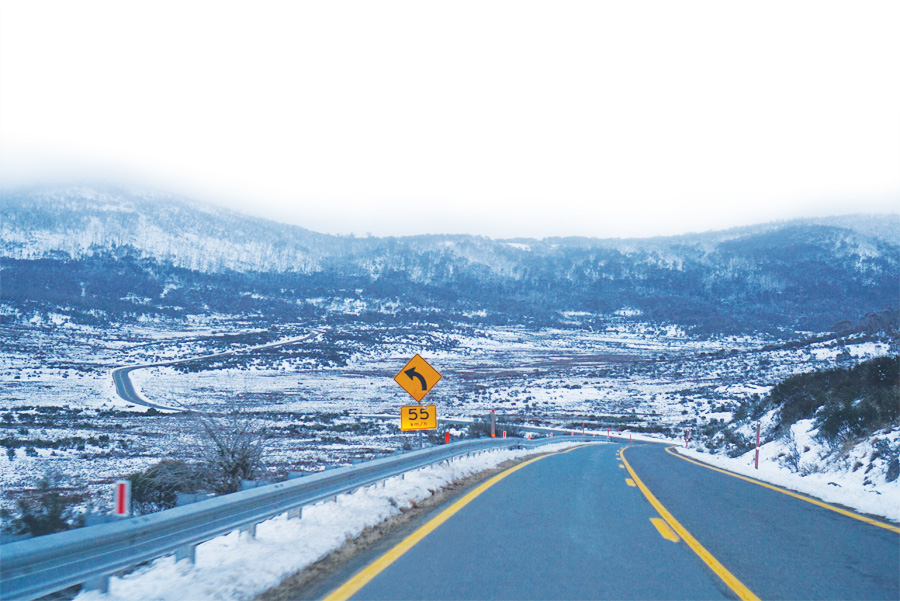
To validate the methodology, Abley compared 10 years of crash data against horizontal curves across the whole road network. It was found that two-thirds, or 67 percent, of loss-of-control crashes occurred on 20 percent of curves classified as unacceptable or undesirable in at least one direction. This finding suggests that by targeting a small percentage of high-risk curves for further investigation and intervention—such as improved signage, surfacing, or side protection—road agencies could greatly reduce the likelihood of additional crashes occurring at these high-risk locations.
Being More Proactive
So far, this is the only known road-network-wide geospatial tool designed specifically to help road agencies identify and prioritize high-risk horizontal curves without needing to collect field data. Because the methodology assesses the risks independent of crash information, road agencies can now proactively target interventions toward high-risk locations and have confidence that safety will be improved—whether or not the location has an established crash problem. The methodology effectively bridges the gap between being aware of major safety issues on high-speed roads and coming up with detailed strategies to reduce the likelihood and consequences of crashes that happen on horizontal curves.
“These guides and tools have revolutionized the way we and our partners are able to view and understand the various road safety risks across the New Zealand road network,” said Colin Brodie, lead adviser of interventions for safety and the environment at NZTA.
This methodology has now been rolled out across all high-speed (80-kilometer-per-hour, or 50-mile-per-hour) roads in New Zealand, which consists of 42,000 kilometers (26,000 miles) of roadway. The Centre for Road Safety in New South Wales, Australia, has also implemented it on 37,000 kilometers (23,000 miles) of state-owned roads. Additionally, the Department of Transport and Main Roads in Queensland, Australia, is close to being able to apply this methodology there.
Austroads safety program manager David Bobberman believes there should be “no surprises for drivers” on the 900,000 kilometers (560,000 miles) of roads that its transportation and traffic agencies collectively manage. Abley’s director, Paul Durdin, shares this philosophy.
“Messaging conveyed to drivers needs to be consistent and reflect the risk of each curve,” said Durdin. “Using Esri technology to identify risks and prioritize for intervention before a crash happens allows road controlling authorities to be more proactive and socially responsible and to ultimately save lives.”
For more information on Abley’s geospatial road safety risk assessment methodology, get in touch with Durdin at paul.durdin@abley.com or +64 3 367 9004 or contact Brodie at colin.brodie@nzta.govt.nz or +64 27 212 5238.

