How a Tennessee Utility Used GIS to Prepare for Spikes in Power Demand from Electric Cars
Online Exclusive
In the 2006 cult-classic documentary film “Who Killed the Electric Car?” consumers, yearning for a petroleum alternative, mourned the loss of the General Motors EV1.

The plug-in vehicle lived a brief and controversial life during the 1990s in the United States. Upon EV1’s demise, electric vehicle proponents wanted someone to blame for the car’s collapse. EV1’s final postmortem diagnosis in the film was determined to be “death by a thousand cuts.” The alleged perpetrators included the government, the automaker, and oil companies. Inadequate batteries, lack of consumer interest, and insufficient electric utility infrastructure were cited as contributing factors.
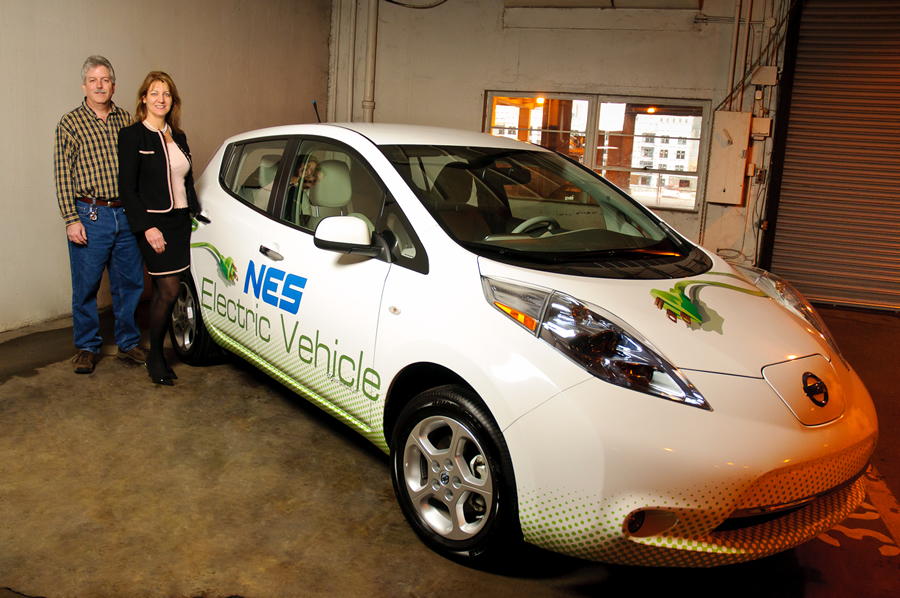
Fast-forward to 2012 as Nissan deploys 300 of its fully electric, no-emission cars, the Leaf, to a launch market in Nashville, Tennessee. In an act of foresight, and perhaps to help ward off another electric vehicle death, Nashville Electric Service (NES) in Middle Tennessee steadied itself for an anticipated rise in consumer demand for electricity as more people buy the Leaf and take it home to charge.
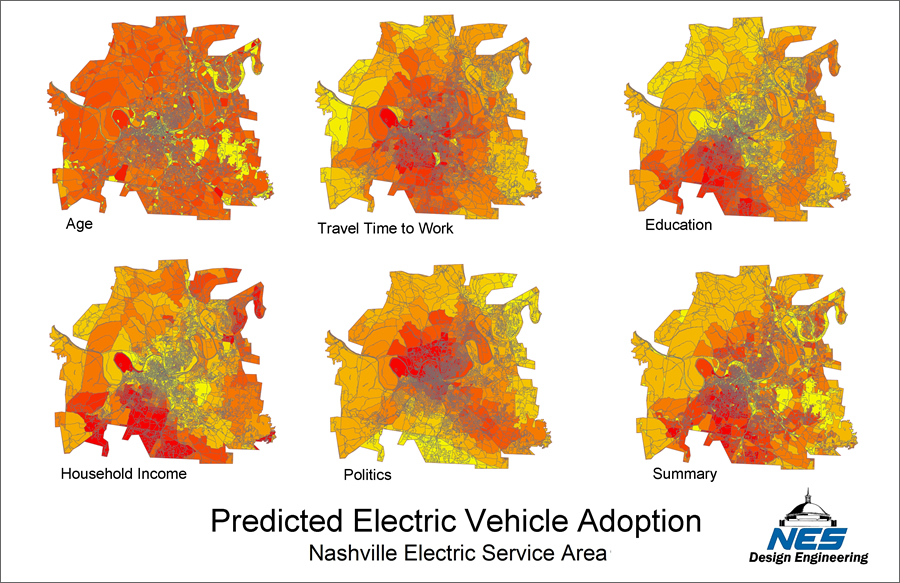
If the utility infrastructure is not ready to meet increased electricity use, customers could experience power outages. Keith Brown, principal associate engineer for the NES Design Engineering, Distribution Planning Group, and NES senior engineer Carla Nelson compiled and analyzed a complex collection of data, then used Esri ArcGIS technology to create Predicted Electric Vehicle Adoption Maps. These maps show clusters where Leaf drivers are predicted to live within the utility service area.
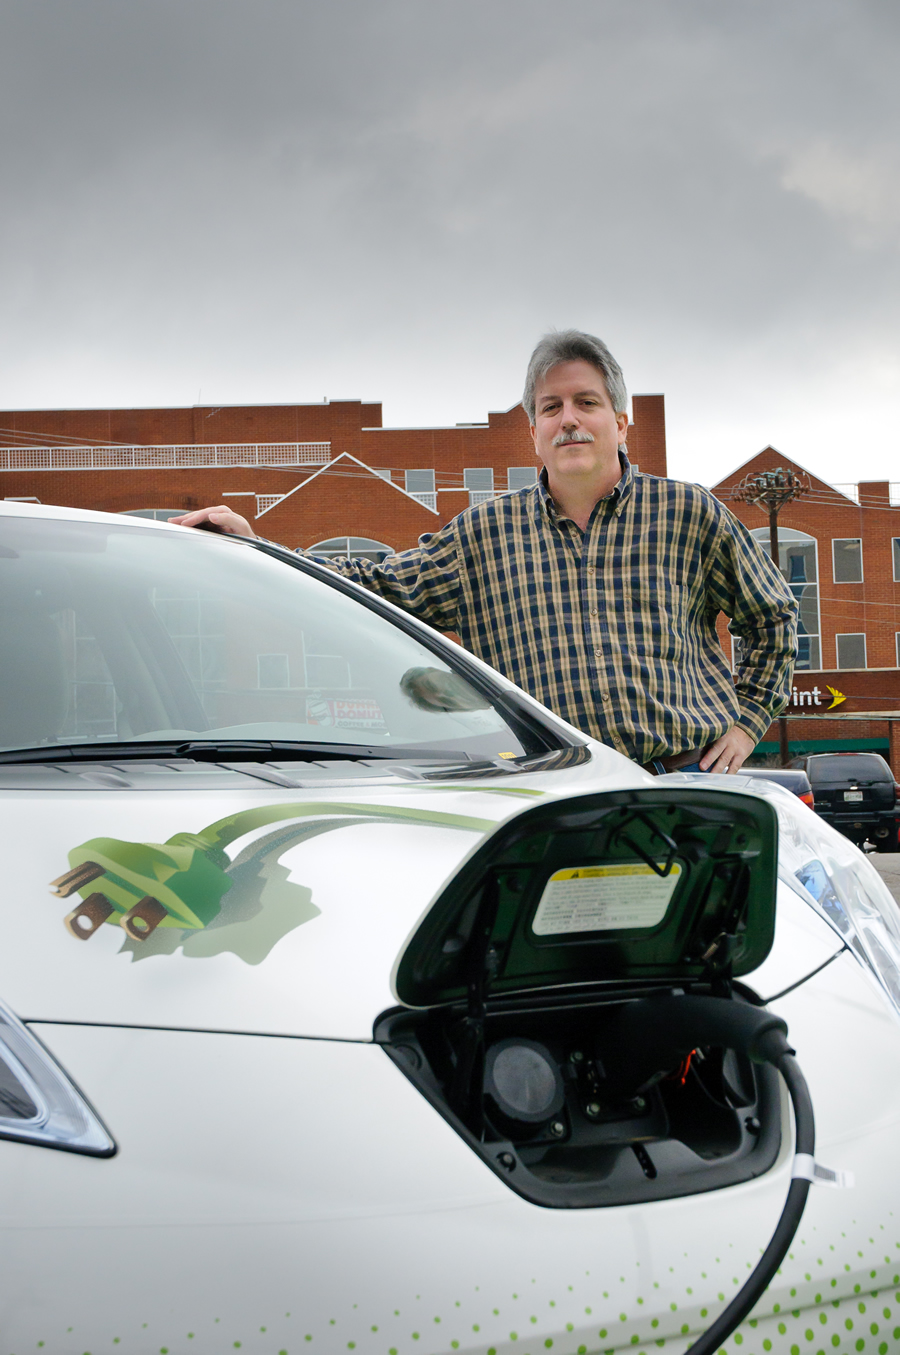
“Electric vehicle deployment is brand new and, like a lot of other utilities, we are still figuring out how this will impact our infrastructure and the best way to prepare for it,” said Brown.
Brown, Nelson, and the NES Distribution Planning Group work to ensure that the electric network has adequate capacity to meet customer demand.
“If people come home from work around 4 or 5 o’clock in the afternoon on a hot day, plug in their electric vehicle and turn on their air conditioner, we have to build up the infrastructure to serve that load,” he said.
Since it takes the Leaf eight hours to get a full charge, Brown figured most vehicle owners will plug in at home. NES needed to profile the people who would likely purchase an electric vehicle and then identify where they live. Brown and Nelson chose Esri ArcGIS technology to create the Predicted Electric Vehicle Adoption Maps because NES has worked with Esri software for the past 15 years and has mapped all of its electric facilities in ArcGIS. Naturally, the utility wanted to be able to relate the study data with the locations of its electric facilities.

The maps were designed and prepared in 2010, two years ahead of the Leaf’s deployment, to help the utility prioritize maintenance projects, upgrade outdated equipment such as wires and transformers, and shore up facilities that would likely experience heightened demand.
Pinpointing EV Hotspots
The NES team surmised that with a few small differences, EV buyers would closely resemble hybrid vehicle buyers.
“We looked at existing marketing profiles for hybrid owners published by firms like J.D. Power and Associates and Scarborough Research,” Brown said. “Among the many hard-to-measure characteristics such as being twice as likely to ski, hike, or practice yoga, we found that owners who purchase hybrid vehicles tend to have attained higher levels of education and report higher household incomes.”
According to a 2007 J.D. Power and Associates’ survey, hybrid buyers are older than the average new vehicle buyer with the most likely age group being 45 to 54. Hybrid buyers drive fewer miles on average and tend to be female. And, according to a 2007 Scarborough Research survey of 110,000 adults, hybrid buyers are more than twice as likely to report themselves as a Democrat than as a Republican.
Brown took this research information and compiled a list of factors. Most could be analyzed using raw US Census data that was not only free but also provided a fine-grained geography so that he could display the results in Esri ArcGIS.
He then developed a set of formulas and custom functions using Microsoft Access and Excel to score the raw data in a way that showed which Census blocks were more likely to be home to electric vehicle purchasers relative to other blocks. The factors Brown selected to support the study included age, gender, population density, education, household income, travel time to work, and political affiliation. Individual factors were scored separately from 1 to 100. The factors were then added together to give a sum score which was also reduced to be between 1 and 100. The study’s design allowed the various factors to be weighted. For example, if the age factor was considered more important than education, it could carry more weight in the sum score.

To incorporate analysis of political party affiliation, Brown and his team obtained shapefiles of the voting precincts and downloaded freely available state and federal election results data for the last ten years.
“I wanted to keep all maps and scoring on a census block level,” Brown said. “I used the spatial analysis Identity tool in ArcGIS to overlay census blocks with voting precincts and transferred the scoring for voting precincts to each of the area’s 20,000 census blocks for the seven county region that we serve.”
Putting EVs on the Map
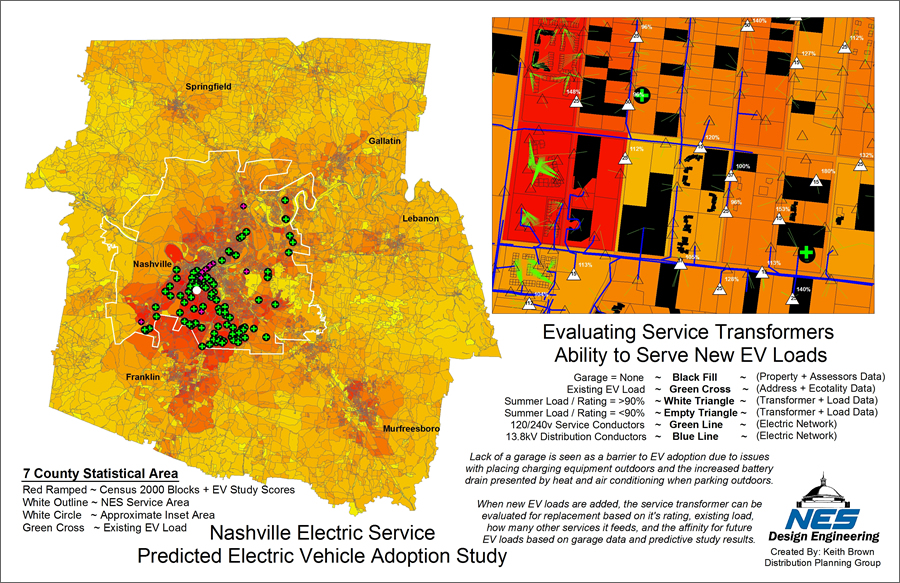
The finished scores were placed in a Microsoft Access database file, added to ArcGIS, and linked to the census block shapefile via a join, providing the shapefile with score values. Those values were used to symbolize the census blocks in 32 shades of red, displaying the scores in a heat map where deeper reds indicate census blocks most likely to have future EV buyers.
The raw census data is stored in a Microsoft Access file and broken down by county. Analysis was completed within Microsoft Access and Excel for all seven counties served by NES, including the regions outside its service area.
The ArcGIS spatial analysis tools and the shapefiles for the NES service area were then used to carve out a new shapefile containing only the census blocks that NES serves. Brown said he specifically chose to work with ArcGIS because it allowed them to perform a spatial join between shapefiles of voting precincts and census blocks.
The first batch of maps identified census blocks with people who have a strong affinity for electric vehicles. However, some were large, rural areas containing only a few people. Since that would amount to very low impact on the electric system, Brown used ArcGIS to produce an impact map where each census block’s summary score was multiplied by its population density score. The impact map more accurately predicts areas of actual electric network load growth due to clusters of electric vehicle adoption.
Brown reasoned that residents of homes without a garage would be less likely to adopt an EV because they would have a problem determining where to place an electric vehicle charger. So he added another map feature to specify whether homes had a garage. He joined data from the Assessor of Property to the property parcels shapefile and symbolized parcels without a garage as black, and parcels with a garage as clear.
“It makes a pretty map,” Brown said. “We’ll see how predictive it really is.”
Once the Predicted Electric Vehicle Adoption Maps were ready, Brown and his team circulated PDFs and printed copies throughout NES to help all departments understand where demand would likely spike and which areas of the electric network may need to be more closely maintained and updated.
“Since two of the study’s driving factors were education and household income which, not too surprisingly, aligned pretty closely with each other, the more affluent areas like Brentwood and Green Hills in the southern portion of our service territory showed higher predicted (EV adoption) rates,” Brown said. “When we added the political component, based on the Scarborough Research survey, it strengthened the prediction for neighborhoods a little farther north into the Hillsboro Village area.”

Customer Needs
NES partnered with the Tennessee Valley Authority (TVA) and the Electric Power Research Institute (EPRI) on a separate study. The study determined which portions of the utility infrastructure are at greatest risk for early impacts, such as localized power outages and overloaded equipment, due to electric vehicle adoption. The results showed that the impact will likely hit the individual service and distribution transformer level. Particular strain will fall upon smaller transformers, transformers serving many homes, and those that are already heavily loaded.
This is good news for NES because transformers and service drops can be replaced more easily and at a lower cost than circuit conductors. The EPRI findings also illuminated the fact that utilities must identify potential problem areas beyond a system-wide view.
NES utilized the EPRI study, as well as the Predicted Electric Vehicle Adoption Maps, when prioritizing capital improvements projects. A top item on the to-do list: convert low voltage (4,100 volt) lines and transformers built before the 1960s to higher distribution voltages.
“Over time, air conditioning and other loads have been added to the system, usually without any changes to the transformers,” Brown said. “So, many transformers are already at 100 percent or more of rated capacity.”
A new Leaf comes with a 110 volt Level-1 slow charger, but NES suspects most people will opt to install the 220 volt Level-2 which has a higher current draw. Overloaded transformers would not bode well for a neighborhood with new electric vehicles parked in garages, nor would it reinforce the customer service or outage management goals set by NES.
“When I added the new charging stations to my predictive map, I was relieved to find those points falling in the red areas,” said Brown. “We’re working to get a regularly updated file from the state showing the addresses of new EV and plug-in hybrid vehicle registrations in our service area which will allow us to be proactive in addressing transformer loading concerns.”
For more information, contact Keith Brown, principal associate engineer, Nashville Electric Service.

