Oregon Department of Geology and Mineral Industries Uses GIS to Serve Data
Online Exclusive
On February 17, 2011, President Barack Obama declared a major disaster in the state of Oregon due to a severe winter storm that caused flooding, mudslides, landslides, and debris flows during the previous month. Western Oregon counties, including Clackamas, Clatsop, Crook, Douglas, Lincoln, and Tillamook, were all affected. The total public assistance cost estimate is more than $6 million.
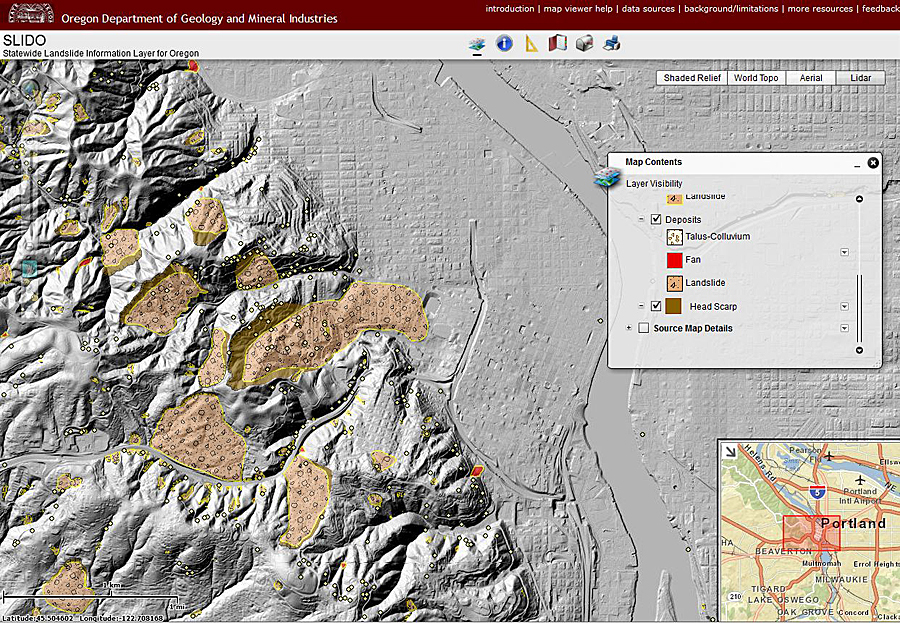
To help mitigate events like this and maintain a safe environment for those living in the state, Oregon’s Department of Geology & Mineral Industries (DOGAMI) is using light detection and ranging (lidar) data to more accurately find and analyze hazards like landslides and debris flow. DOGAMI also makes this lidar data available to the public using an innovative solution based on ArcGIS, the standard GIS platform used in the state.
Seeing the Hazards Through the Trees
Oregon is known for its natural beauty. From cliff-lined beaches to snow-capped mountains, the landscape has been formed into modern-day eye candy by a millennia of geologic processes. With this beauty comes danger—the earth’s movements that created such breathtaking views can also be the cause of destruction. Natural hazards, such as floods, landslides, earthquakes, coastal erosion, volcanic eruptions, and tsunamis, are all possible and have occurred in Oregon over the past century.
Maintaining an accurate inventory of these hazards can be difficult in a region that contains such lush tree cover and is subject to more cloudy days than sunny. Traditionally, aerial photography is used to create topographic data through stereo pair analysis, but this method cannot always capture the detail needed to identify hazard locations and accurate model inputs.
When DOGAMI staff first started using lidar, they discovered they weren’t even close to mapping the entire landslide hazard inventory of western Oregon. “The technology has proven to be invaluable in improving the accuracy of Oregon’s hazard inventories,” says Rachel Lyles Smith, GISP, a project operations manager in the Geologic Survey and Services program at DOGAMI.
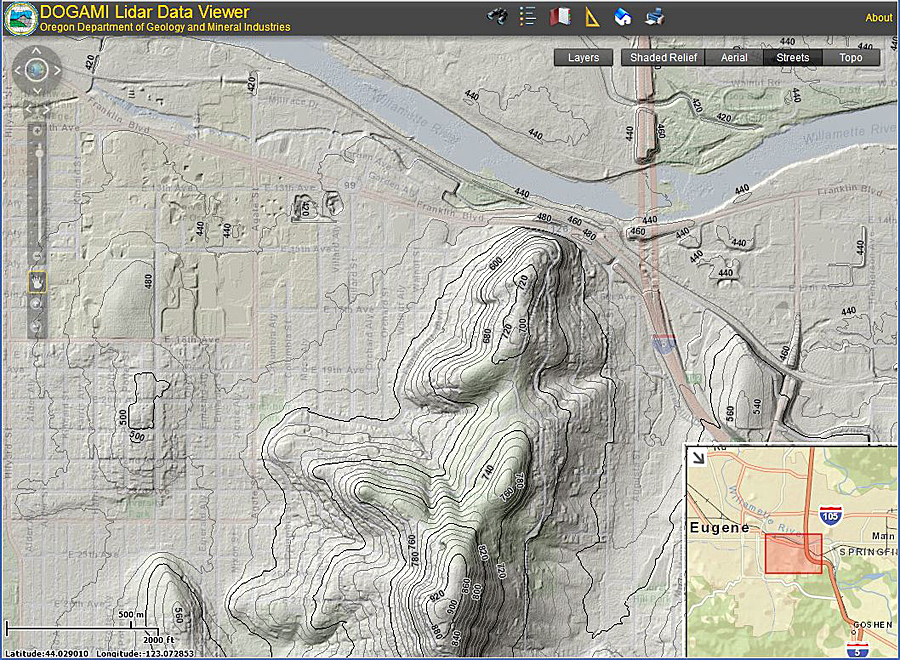
Lidar data is used to create bare earth digital elevation models (DEMs)—a representation of the earth’s surface where all man-made structures and vegetation have been removed. These DEMs are much more accurate than those based on aerial imagery. The detailed topography of lidar-derived DEMs has greatly improved the precision of hazard mapping, as well as many other mapping efforts throughout the state.
Hazard Mapping with Lidar
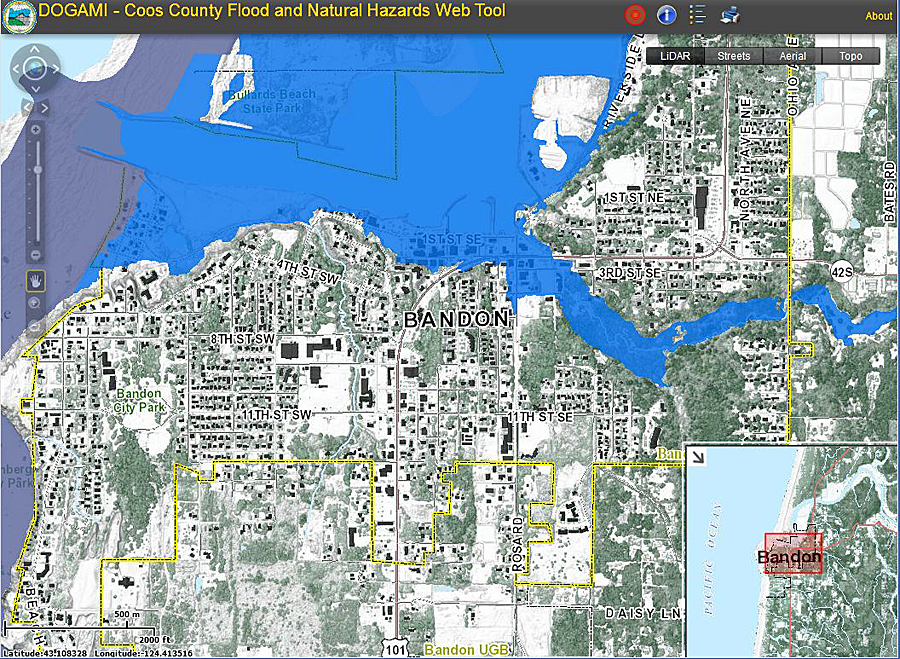
In addition to landslide mapping, DOGAMI is utilizing lidar as the driver for new projects associated with other natural hazards throughout the state of Oregon. Coos County was the first county in Oregon to receive updated approximate flood zones that used lidar topography to update inundation layers. DOGAMI also used lidar and lidar-derived products to update and correct basemap layers, which greatly improved Digital Flood Insurance Rate Maps both in detail and readability.
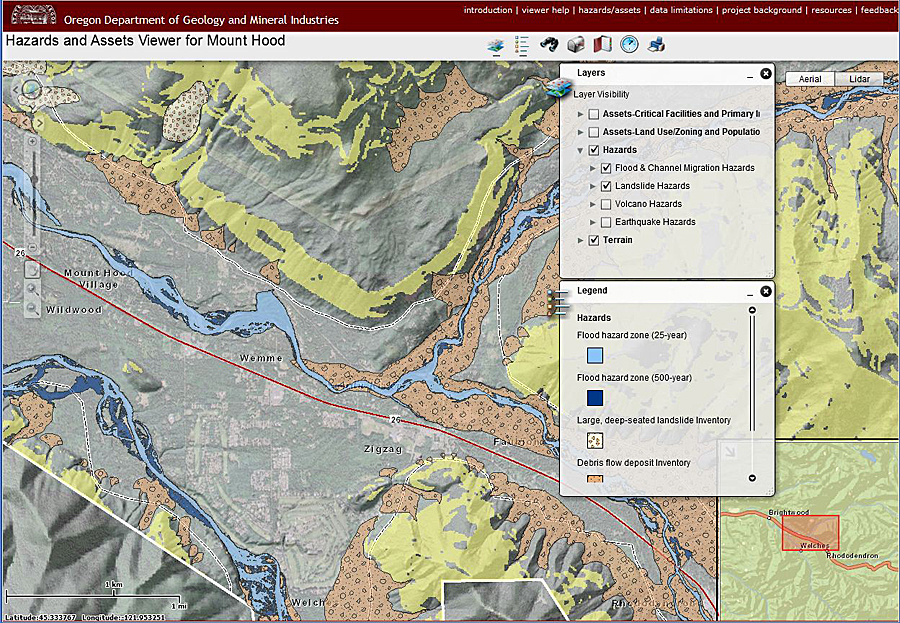
DOGAMI recently released Multi-Hazard and Risk Study for the Mount Hood Region, Multnomah, Clackamas, and Hood River Counties, Oregon, to help communities on or near Mount Hood become more resilient to geologic hazards, including volcanoes, landslides, floods, channel migration, and earthquakes. The study demonstrated the necessity of high-resolution lidar data for multihazard mapping, including locating landslides and faults and redelineating flood and volcanic mudflow hazard zones. Lidar data is also critical for mapping assets, such as buildings and infrastructure. The accuracy and fine-scale resolutions of the hazard, asset, and risk data make the results more credible and thus more likely to be useful in risk reduction.
DOGAMI manages the National Tsunami Hazard Mitigation Program, which has been administered by the National Oceanic and Atmospheric Administration (NOAA) since 1995. DOGAMI’s work is designed to help cities, counties, and other sites in coastal areas reduce the potential for disastrous tsunami-related consequences through understanding and mitigating this geologic hazard. DOGAMI has developed a new generation of tsunami inundation maps and evacuation brochures using ArcGIS to help residents and visitors along the entire Oregon coast prepare for the next Cascadia Subduction Zone earthquake and tsunami. Lidar data for the Oregon coast was acquired between 2008 and 2009.
The onshore lidar has been integrated with offshore and near-shore bathymetry, providing greatly improved topographic inputs for tsunami modeling. With NOAA funding, DOGAMI and Oregon Health and Science University have worked to successfully model tsunami inundation scenarios for the entire Oregon coast. The detailed topography improved model outputs by providing greater definition and inundation accuracy. These improvements have allowed DOGAMI to better educate and inform coastal communities of the risk of tsunami hazards.
Throughout the state of Oregon, local municipalities, state and federal agencies, and tribal communities have been applying lidar topographic data to all aspects of mapping. “One of the great things that has come from this mass of data is a coming together of users and sharing of ideas,” says John English, the lidar database coordinator at DOGAMI. “People have found new ways to address geospatial needs; lidar has changed the way Oregon thinks about mapping.”
Lidar for Everyone
DOGAMI staff embarked on an ambitious project to make lidar data available and searchable on the web so that anyone could compare and contrast lidar data against aerial photographs, topographic maps, and 10-meter DEMs for their own education. In 2011, DOGAMI began using ArcGIS Viewer for Flex to create an interactive map tool that allows anyone with a web browser to view the lidar data at 1:9,028 scale. Viewers can navigate using pan and zoom and can hide and display different data layers depending on their interests.
One of the most helpful tools for people not familiar with navigating an interactive map is the overview map. This index map uses the Esri Street Basemap and overlays a red box to indicate the extent of the primary lidar data viewer. Controls at the top right of the main map display allow viewers to search for and identify DOGAMI Lidar Data Quadrangles, as well as take action with other controls, such as show and hide the map legend, draw and measure on the map interface, and find and zoom to an address. The current extent of the data viewer can be printed as well.
Coordinating Lidar Collection
DOGAMI has been overseeing the collection of lidar throughout the state of Oregon since 2008, when the Oregon LiDAR Consortium (OLC) was formed. The OLC has been the most successful consortium model in the United States, collecting 13.9 million acres of high-density data throughout the Northwest. DOGAMI continues to supervise and coordinate the collection of large swaths of lidar data in Oregon, as designated by the Oregon legislature. Using a nationwide selection process, DOGAMI has a state price agreement in place with Watershed Sciences Inc. of Corvallis, Oregon, for a predetermined unit cost based on the size of project areas. DOGAMI and consortium partners (which include local, state, federal, and tribal agencies) have combined interests and funding to facilitate Oregon’s many lidar data needs.
For more information, contact Rachel Lyles Smith, project operations manager, Oregon Department of Geology and Mineral Industries. View the 33 terabytes of lidar data that is available to the public for viewing and purchase. By using the Lidar Quad Search/Purchase tool that is available on the map, a wide variety of Lidar Data Quadrangle publications can be located and ordered.

