This is the first of a regular column of the International Cartographic Association (ICA) in ArcNews, reflecting the long and outstanding cooperation between Esri and ICA. Issues related to the world of cartography and ICA and reflecting a variety of topics will be discussed and presented here. You can expect a broad range of themes, such as the history of maps; cognitive processes in cartographic communication; and the application of the newest technologies on cartography, for example, currently augmented reality, applications for location-based services, and service-oriented cartography.
Why would reading this column eventually be beneficial to you? And what is the International Cartographic Association, and why could that have something to do with your interests?
Why Will This Column Be Beneficial to You?
For this first question, I would like to refer to my contribution to the ArcNews Winter 2013/14 issue, where I argued that the domains dealing with spatial data are growing fast. There are more and more techniques, algorithms, sensors, and software available that can contribute to data acquisition, data modeling, and data analysis. There is huge potential in spatial data, and we are definitively not short of data. Rather, it’s just the opposite. The problem is often not that we don’t have enough data but too much. We need to make a greater effort to deal with all this data in an efficient sense, mining the relevant information and linking and selecting the appropriate information for a particular scenario. We are also not short of technologies. Here, too, it is the opposite. Just as we are learning to fully employ the potential of a particular new data acquisition, modeling, or dissemination technology, new technologies are developed and need to be considered. New technologies become available more quickly and need to be evaluated, addressed, and applied.
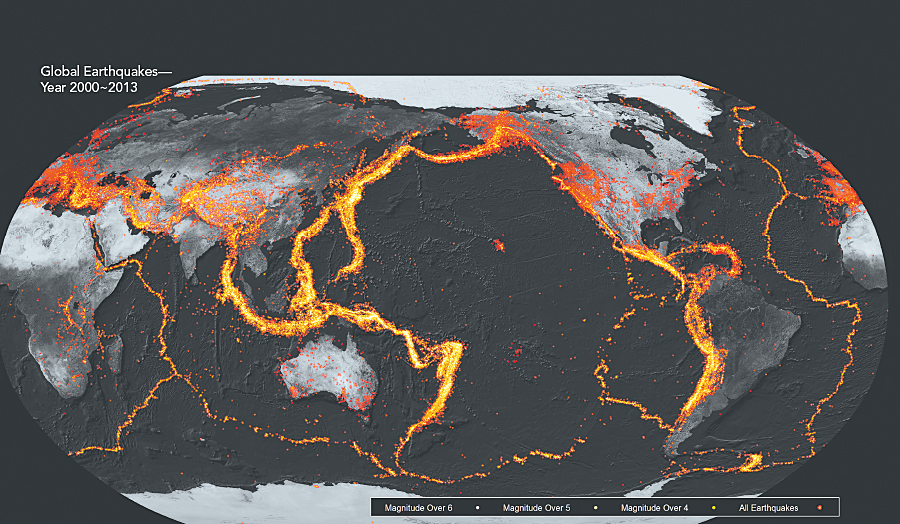
But how is the world participating in all our developments and improvements? How will a new sensor solution or new algorithms be of benefit to a decision maker? To a tourist? To a citizen? At the end of the day, maps play a key role in this context. Whenever we talk about spatial data or geoinformation, and whenever this information needs to be presented and communicated to a human user, the interface and all the intelligence behind it can very often only be “unleashed” through a map. I would go as far as arguing that investing in maps means investing in the overall success of spatial data handling.

This is because maps are most efficient in enabling human users to understand complex situations. Maps can be understood as tools to order information by their spatial context. Maps can be seen as the perfect interface between a human user and all that big data and thus enable human users to answer location-related questions, to support spatial behavior, to enable spatial problem solving, or simply to become aware of space.
In the near future, we can expect that information will be available anytime and anywhere. In its provision and delivery, it will be tailored to the user’s context and needs. In this, the context is a key selector, determining which information is provided and how it is provided. Cartographic services will thus be widespread and of daily use in a truly ubiquitous manner. Persons would feel spatially blind without using their map-based services, which enable them to see who or what is near them, get support and do searches based on the current location, and collect data on-site accurately and timely. Modern cartography applications are already demonstrating their huge potential and changing how we work, live, and interact.
Investing in cartography means to make sure that the interface between a human user and the data and geoinformation—with all the efforts being done to derive, model, or analyze it—works, allowing the data and information to be used!
What Is the International Cartographic Association?
The International Cartographic Association is a forum for those who work with, produce, and use maps; are interested in map design; want to know about cartographic generalization; want to be informed about the newest mapmaking technologies; or simply love maps. Basically, the organizational structure of ICA welcomes nations as members, as well as companies and institutions as affiliate members. In addition, the ICA provides its commissions—where aficionados of a particular topic meet and discuss their area of interest—which are open to everybody who is interested and wants to participate. Check out your area of interest at www.icaci.org/commissions.
ICA is especially interested in linking those who deal with maps and promoting the importance and power of maps as instruments to communicate spatial information to everybody. In this sense, instruments like the Barbara Petchenik Children Map Drawing Competition are very popular, as well as cartographic exhibitions, cartographic conferences, and the planned International Map Year. This means that through ICA, any cartographic product or outcome of spatial data handling can eventually attract a more dedicated audience, while members have the benefit of having their maps evaluated and tested through connection to the global community of cartography that is ICA, leading to the development of the skills, knowledge, and competencies needed to make great maps.
Find out more at www.icaci.org.
About the Author
Georg Gartner is a full professor of cartography at the Vienna University of Technology. He holds graduate qualifications in geography and cartography from the University of Vienna and received his PhD and his habilitation from the Vienna University of Technology. He was awarded a Fulbright grant to the University of Nebraska at Omaha in 1997 and a research visiting fellowship to the Royal Melbourne Institute of Technology in 2000, to South China Normal University in 2006, and to the University of Nottingham in 2009. He is a responsible organizer of the International Symposia on Location Based Services and editor of the book series Lecture Notes on Geoinformation and Cartography published by Springer. He is also editor of the Journal on LBS by Taylor & Francis. He serves as president of the International Cartographic Association.
For more information, contact Georg Gartner (e-mail: president@icaci.org).


