The July update to ArcGIS Online includes a number of enhancements and new features to make it easier to use—many of which were based on your feedback. Here are nine highlights from the update. More details and helpful resources can be found on the What’s New page for ArcGIS Online.
Smart Mapping Transparency
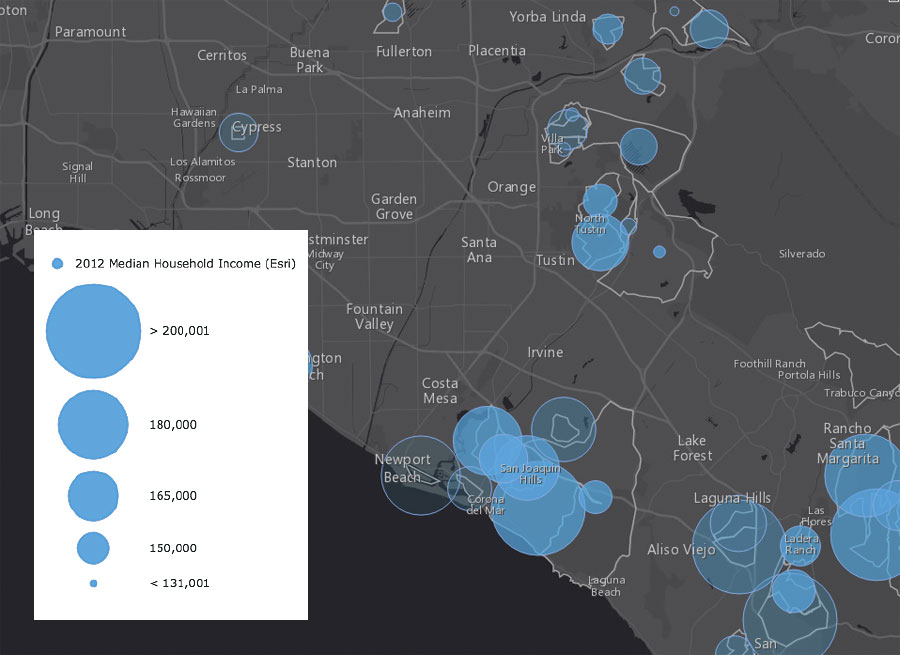
Use Counts and Amounts (Size) to vary the transparencies applied to numeric-based attributes by location. When used with polygon layers, the tool can even adjust the size range automatically so the symbols look better across zoom levels. Border widths and transparencies also self-adjust when mapping polygon layers, which improves a map’s usability.
Workflows and Design
To better document and communicate the authority of your data, you can now enable standards-based metadata for items and configure the editing and viewing of the metadata.
In terms of improved design, several basemaps—including Imagery with Labels, Dark Gray Canvas, Light Gray Canvas, World Oceans, and Terrain with Labels—now display feature layers between two layers so the basemap labels are more legible.
Map Viewer,More Adaptable
You can now sign in to ArcGIS Online directly from the map viewer, so you won’t lose any work done in the map viewer prior to logging in.
Once inside, you’ll notice that some buttons have moved and been enhanced. The Change Style and Show Table buttons appear directly under the layer name in the layer menu, alongside a button to open the full set of actions for the layer. The New Map button includes a drop-down list of your recently viewed maps.
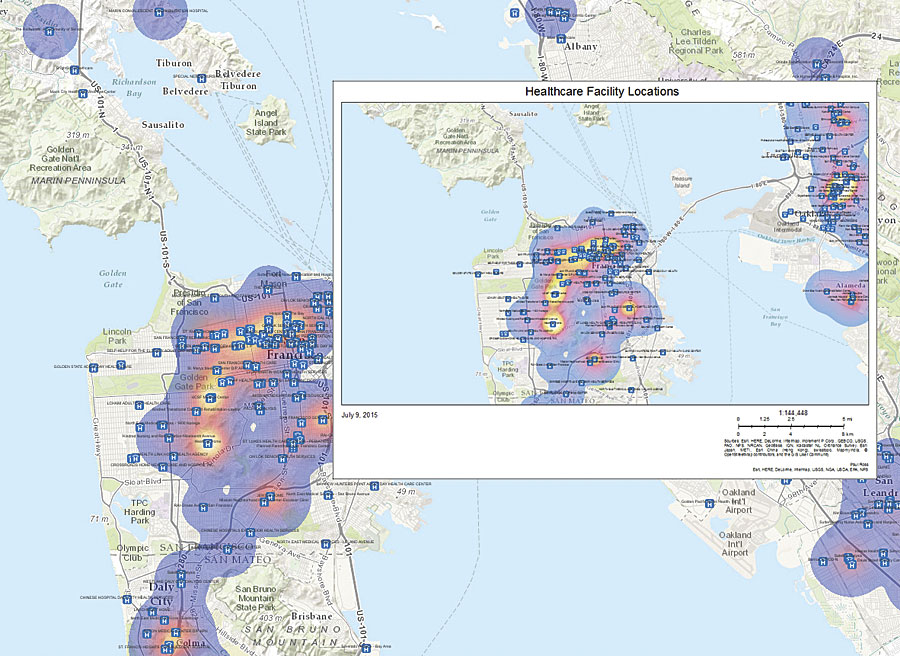
When searching within a map, you can now scour all available resources or choose a single resource. Searchable feature layers support integer fields as well, and search results can be added to a map notes layer.
You can now use data fields for labels, and embedded maps are more responsive to different browser sizes and devices. When printing, you can also include custom print layouts from ArcGIS for Server for a more tailored print experience.
3D Scene Viewer Improved
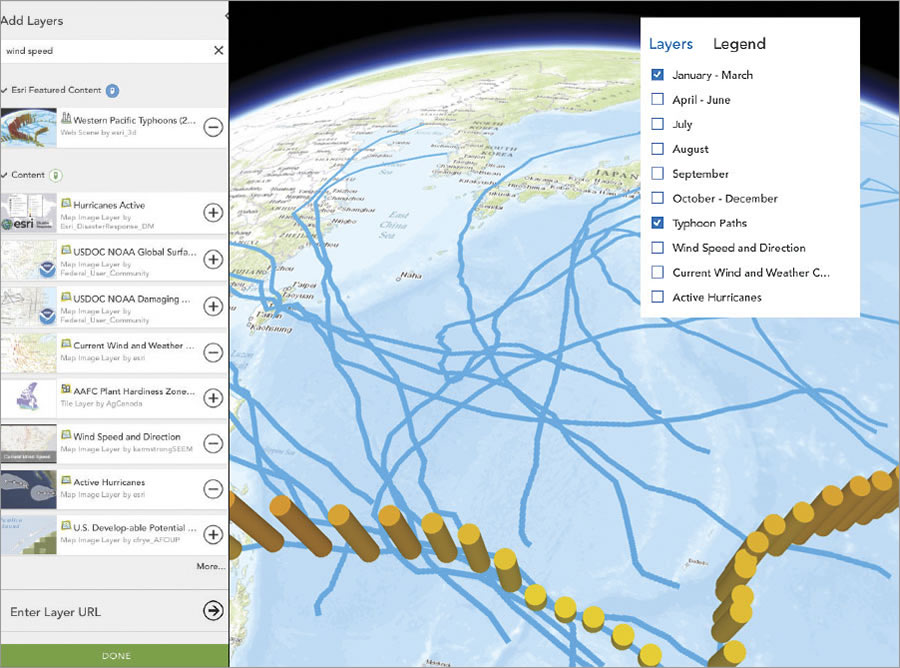
As with maps you create in the map viewer, scenes can now be embedded in a website or shared via email or social media. You can view scenes in full-screen mode; use OpenStreetMap as a basemap; store sun and shadow settings; and, with the new 3D extrusion symbol, change 2D polygon symbols to display as 3D volumes. It is also now possible to see underground layers by turning on See Through Ground (in beta). In Add Layers, there’s now a remove option, so you can delete layers you added from your scene. And if you speak Arabic or Hebrew, you can experience scene viewer in those languages as well.
Enhanced Analysis
There’s a new analysis layers gallery for the Living Atlas of the World, a rich set of high-quality maps and layers of imagery, boundaries, demographics, and more from Esri and ArcGIS users. It is now easier to discover and add these dynamic layers—which include common geography layers such as country, state, and census boundaries—to your analysis workflow.
For directions and proximity analysis tools, configure travel modes to yield better routes and analytical results. You can also define your organization’s transportation network settings and vehicle standards so you don’t have to select these each time you use them.
Additionally, we’ve improved how you interact with analysis features. There is now an Analysis button at the top of the map viewer to make analysis easier to find. You can interactively specify the starting points for Create Viewshed, Create Watersheds, and Trace Downstream. And Find Hot Spots is now more intuitive.
Feature Layer Updates
If your source data is updated frequently, there’s now a better way to maintain the URL and layer properties in the hosted feature layers you use in maps and apps: You can overwrite features in hosted feature layers published from CSV files (as well as file geodatabases, shapefiles, and GeoJSON files) that contain latitude and longitude information. A new set of data collection templates is also available for creating hosted feature layers used with Collector for ArcGIS.
Growing Content
The Living Atlas of the World is now easier to access through the Gallery. Esri Featured Content, also in the Gallery, now includes a more comprehensive set of maps from the Living Atlas, including maps for your local region. The map viewer also features a Browse Living Atlas Layers option for adding these layers to your maps. Also new is the Living Atlas contributor app, which you can use to nominate your map or app to become part of the Living Atlas.
We updated basemaps and imagery services as well. The World Street Map has new data for Europe and dual-language labeling for several countries, including Russia and Greece, and now includes detailed content for South Korea. The Arctic area basemaps, including Arctic Imagery and Arctic Ocean Basemap, are no longer in beta. National Agriculture Imagery Program (NAIP) image services have been updated with NAIP 2014 imagery, and World Imagery has been updated at large scales (L14–L17) with NAIP 2013 and 2014 imagery for most of the continental United States. World Elevation Layers now includes 30-meter data for Asia and Australia. And this same data is available in the Terrain 3D layer used in the Scene Viewer and other apps. Finally, standard global demographics for 45 countries have been updated with more current data.
Amplified Apps
In Web AppBuilder for ArcGIS, there are five new themes to choose from, along with several new widgets, including a Stream widget for visualizing and controlling real-time data feeds from streaming feature layers.
ArcGIS Open Data now has feedback loops that let the public comment on your data so you can engage with citizens, more easily identify data that needs to be updated or improved, and understand where to focus your maintenance efforts. We also included support for standards-based metadata.
In Operations Dashboard for ArcGIS, administrators can now add extensions to their organizations, which publishers can use inside their operations views. Developers and partners can write new widgets, map tools, and feature actions using ArcGIS API for JavaScript.
Don’t forget to check out our new apps. Navigator for ArcGIS improves workforce mobility, while AppStudio for ArcGIS (in beta) lets you build native apps that work on Android, iOS, Windows, OS X, and Linux devices—no developer skills needed.
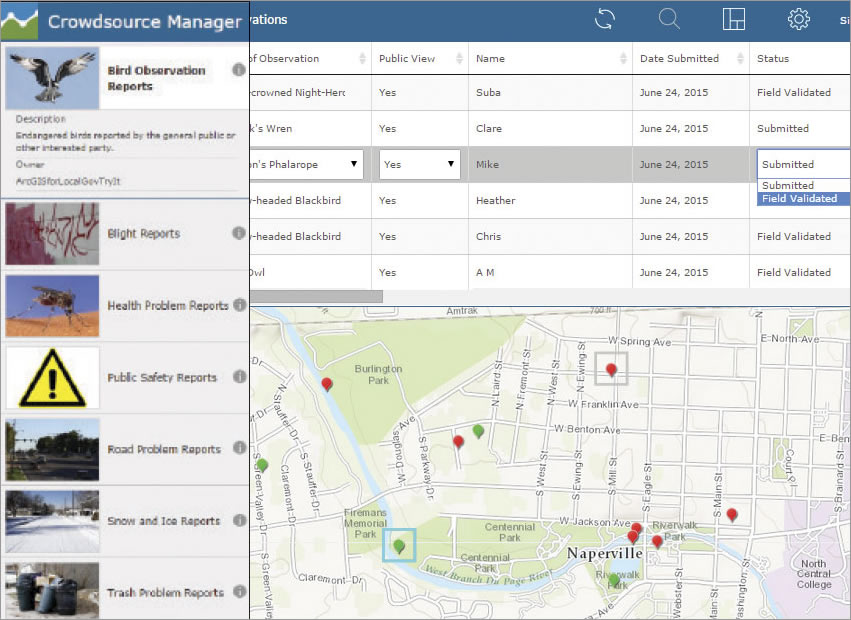
We also updated the Crowdsource Manager and Crowdsource Reporter app templates; made a new version of the Time Aware app template; and renamed the Chrome-Twitter app template to just Twitter.
Better Administration
With enterprise logins, you can now configure the sign-in page to either show only the enterprise login option or both the enterprise login and the ArcGIS account sign-in options. To make it easier to manage users and groups, administrators can also assign new members in bulk to multiple groups as part of the invitation workflow or the group’s configuration setting. Moreover, in addition to being able to manage your ArcGIS Pro licenses in ArcGIS Online, you can now manage your Navigator for ArcGIS licenses there.
The Open Data tab provides a high-level summary of the Open Data sites an organization has created, as well as a list of the organization’s Open Data groups. Administrators also have the option to add Open Data curators to groups from the Open Data tab.
If you have ArcGIS Online workflows that require several members of your organization to update the same map, you can allow members of the group to modify items shared with that group. That means that people working in emergency operations centers, for example, can update the maps, item details, and content that form the basis of their apps and dashboards. They can also have full editing control over hosted feature layers that have been shared with the group, even if the layer appears uneditable to the rest of the group. During a disaster, for instance, members of the group could use their authoritative data to update a public-hosted feature layer that shows available resources, and while others would be able to see the updates, they wouldn’t be able to make them.
On the View Status page, administrators can now view service credits reports or data range reports for a one-year period rather than just 90 days. New drill-down and drill-through reports also reveal specific information as you interact with them, such as the number of new or modified items that have been added. Service credits reports for premium content have been expanded as well to include subscriber content, imagery maps, and landscape maps. And additional member reports are available for login activity, service credits usage, and role information.

