Buffalo, New York, gets snow—and lots of it. Last winter, a number of surrounding areas—including parts of Erie, Niagara, Chautauqua, and Cattaraugus counties—were pummeled by lake-effect snowfalls.
During a snowstorm, Region 5 of the New York State Department of Transportation (NYSDOT) is responsible for maintaining 3,675 lane miles (length plus number of lanes) of highway used by commuters, freight haulers, and emergency responders in western New York. To do this, NYSDOT snowplow operators clear the roads on their assigned snow and ice beats while emergency managers use GIS in the background to help predict where the storm is going to make the biggest impact.
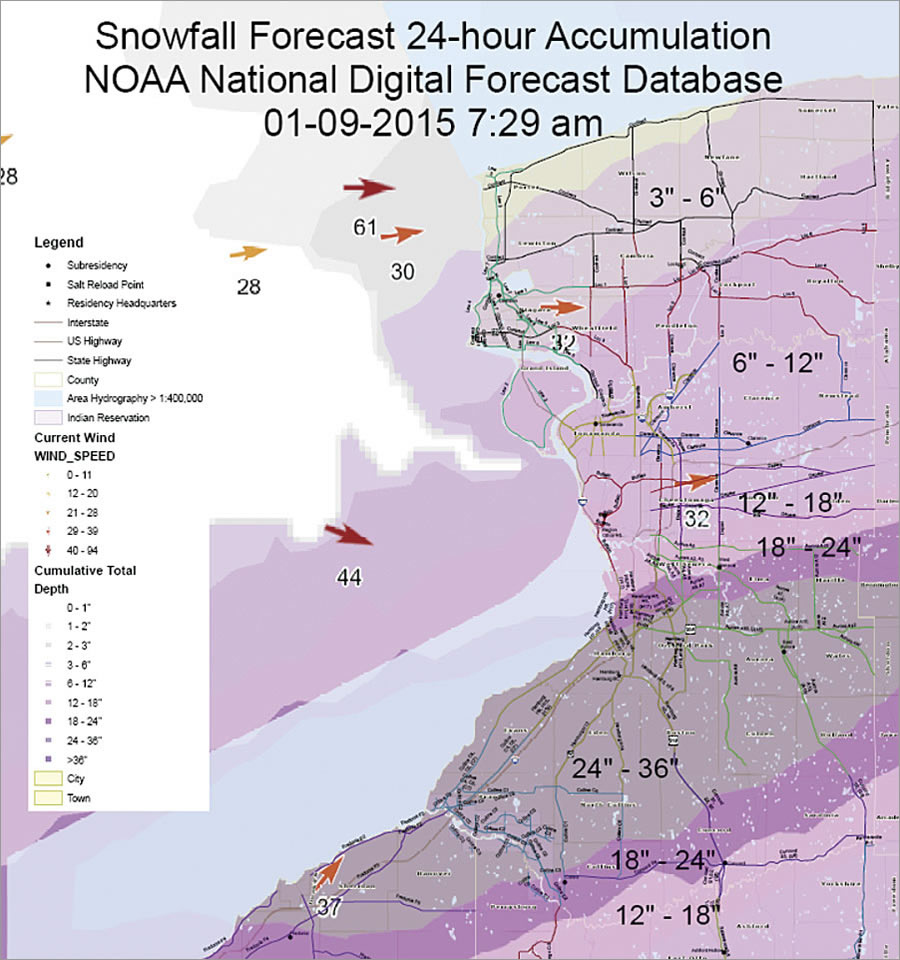
With assistance from the National Weather Service, the NYSDOT Emergency Operations Center developed two ArcGIS software-based map applications in January 2015 to help emergency managers better respond to severe snowfall events. To achieve more encompassing situational awareness, practitioners wanted to create reliable snowfall forecast maps that could be analyzed using GIS to predict a storm’s impact on the transportation network.
Getting Accurate Snowfall Forecasts
Finding reliable sources of snowfall forecast data was challenging. NYSDOT does not maintain or generate weather forecasting data or mapping, so researchers at the department explored the data and tools available on ArcGIS Online to see what they could find.
The group quickly discovered that users affiliated with Esri generate a number of mapping products available to the ArcGIS Online user community. One of the maps NYSDOT discovered was the Severe Weather Web Map, which contains information from the National Weather Service.
According to federal policy, the National Weather Service is required to provide a diverse suite of products and services derived from its digital forecast databases. To get the most accurate and up-to-date snowfall forecasts, the National Weather Service uses its National Digital Forecast Database (NDFD), which collects weather data 24 hours a day from field stations across North America. The NDFD makes its weather observations, forecasts, and warnings available to the public via databases that can be converted into maps, graphics, and GPS points.
NYSDOT ended up consulting with the National Weather Service’s Buffalo field office, which recommended using the Severe Weather Web Map for its mapping applications. The map uses NDFD gridded raster data in KML format to show predicted snowfall, so NYSDOT implemented it as its basemap in ArcMap. A critical step was being able to convert the data from KML into layers using the KML To Layer tool in ArcGIS for Desktop, which allowed NYSDOT to adjust the symbology and further refine the weather data.
Engaging Framework Data
NYSDOT also has GIS framework data that consists of various feature classes for highways, capital assets, community facilities, and natural landforms. The highway network data, symbolized as lines, documents all the highways NYSDOT is responsible for maintaining. DOT storage facilities that house plowing equipment, salt, liquid deicing agents, and fuel are represented as point feature classes. The framework data displays the maintenance boundaries for each NYSDOT office as well, and Region 5 has GIS data that shows the highway routes traversed by specific plow drivers.
The initial purpose of developing this framework data was to create operational maps for snow and ice removal. However, the NYSDOT researchers repurposed it to figure out which DOT facilities and plow routes could be most impacted by a severe snowfall event. Combined with the GIS data for predicted snowfall, NYSDOT could understand the magnitude of expected conditions, as well as the spatial context needed to begin planning snow removal.
Two Advantageous Maps
After the NDFD and NYSDOT GIS framework data was incorporated into ArcGIS Online, the department created two map layouts that the Emergency Operations Center can activate for severe snowfall response. The 72-Hour Cumulative Snowfall Map, which is updated every 12 hours during events to help plan for upcoming operational periods, displays the predicted snow accumulation in the area plus the parts of the transportation network and locations of NYSDOT facilities expected to be most affected. The 6-Hour Snowfall Forecast Map goes a step further, displaying the forecasted snowfall amounts in 6-hour increments. This allows NYSDOT to estimate the predicted rate of snowfall per hour.
Using these maps—which are printed and posted on the walls of the Emergency Operations Center and emailed in PDF form to affected DOT offices—emergency managers can keep emergency responders well informed about potential conditions. Managers can also identify areas where a storm may have the greatest impact on transportation so they can allocate NYSDOT resources there for a specified amount of time.
For more information, contact Matthew Balling, NYSDOT Region 5 transportation analyst.

