ArcGIS Open Data
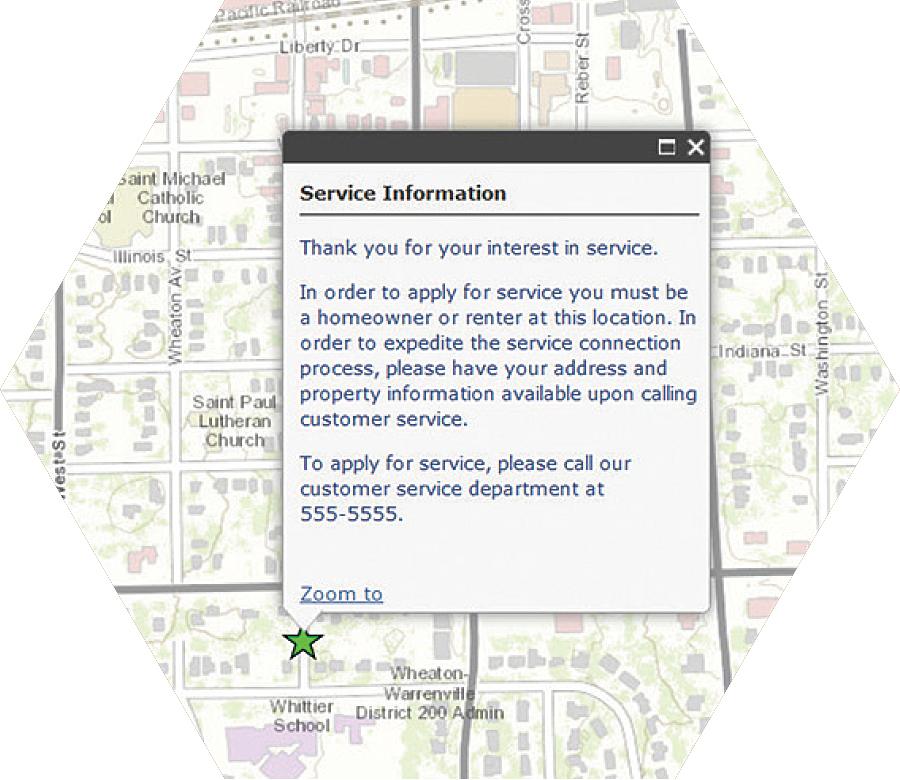
ArcGIS Open Data functionality, previously in beta, was officially released and localized in 24 languages. With the Open Data feature in ArcGIS Online, you can use the ArcGIS platform to provide the public with open access to your authoritative data. It leverages services you’ve already published and provides a home page layout you can quickly customize, so setting up your Open Data site can be done in as little as 10 minutes.
During beta, more than 750 user organizations enabled Open Data including the State of Wyoming’s GeoHub, Data Driven Detroit, and the State of Maryland’s iMap GIS Data Catalog.

Ready-to-Use Apps
Explorer for ArcGIS is now available on Mac, and the new iOS version of Explorer for ArcGIS supports time-aware maps. It has been localized in multiple languages. Collector for ArcGIS lets you search for features in a map and switch between offline basemaps. The browser version of Operations Dashboard for ArcGIS now supports feature actions on multiple features and map services as data sources. In addition to improvements to the user experience, Activity Dashboard for ArcGIS now has several new reports that provide details about usage and credit utilization. Find these reports on the Items and Users tabs.
Hosted Features and Tiles
Attachments added to hosted feature layers after July 2, 2014, are now stored as files instead of features, which reduces storage costs for your organization. You can now publish the contents of a file geodatabase as a hosted feature layer. Exporting hosted features was enhanced. Now individual layers from a hosted feature layer can be exported as a file geodatabase, a shapefile, or comma-separated value (CSV) files. File geodatabase export includes all the tables and attachments in the layer.
Now when you publish a hosted tile layer from an existing hosted feature layer, you can use a tiling scheme defined in any existing ArcGIS for Server based tile layer instead of the default Web Mercator that is used by ArcGIS Online basemaps.
Other Changes
Existing and new Esri accounts (formerly known as Esri Global accounts) are automatically ArcGIS public accounts so you no longer need to register the account with ArcGIS Online. ArcGIS Online members no longer need to agree to terms of use when they create an account or join ArcGIS Online. However, the person activating the subscription or trial and public account users will still need to agree to the terms. The Invite Users button has been renamed Invite Members and the wording for inviting members rewritten.
App Templates
With the new Map Journal configurable Story Map app template, you can present a map-based narrative organized into a set of journal entries. This creates compelling multimedia stories that combine text, graphics, and maps, and is especially good for maps that have lots of text and details.
Use this new configurable Local Perspective app template for highlighting features from a map based on user-selected locations or addresses. You can include demographics and lifestyle data and weather information and enable driving directions.
The new GeoForm configurable app template lets you edit feature data in a form rather than a pop-up window. This template is available in the Early Adopter Templates group in ArcGIS Online.

The Information Lookup and Impact Summary app templates have been moved from the Early Adopter Templates group to the Esri-featured configurable app gallery.
The Basic Viewer app template has been renamed. Now called the Classic Viewer, it is still available in the gallery and the Esri default map viewer template gallery.
Existing templates are being modernized with updated styles and more adaptable designs for mobile devices. In the July release, Classic Viewer, Simple Map Viewer, and Filter were redesigned and now support feature search.
Map Viewer
You can now create a presentation based on your map contents. A presentation is a collection of slides that can show specific locations, layers, pop-up windows, basemaps, and titles. Each presentation slide is a dynamic map that you can pan, zoom, and interact with. And it’s also a great way to share your maps with others.
Create labels for features in a layer by selecting one or more attributes to display for each layer (e.g., name or type of feature). Labels are automatically placed on or near the features they describe. You can control text size, color, style, and alignment.
The new option for walking directions takes into account attributes that affect routing for pedestrians.
Configure feature searches on the feature service layers in your map using the map viewer’s search. For example, you can enable search on a parcel layer so others can find specific parcels using the assessor’s parcel number (APN). When someone enters the APN into the search box, the map zooms to the matching parcel and displays a pop-up window.
You can also configure pop-up windows to show related data in your map layers. Related data is displayed within the pop-up window in a chart or in a table at the bottom of the map. When you create data relationships in ArcGIS for Desktop, you can publish the data to ArcGIS Online or ArcGIS for Server (version 10.1 or later).
ArcGIS Administration and Security
The page where you can configure roles has been redesigned to improve the usability and make it easier for administrators to manage custom roles. Administrators now see the number of members assigned to each role and have more direct access to view information, edit, and delete custom roles. Custom roles now include privileges for using demographics, geocoding, GeoEnrichment, network analysis, spatial analysis, and ArcGIS Marketplace.
Esri’s new web site trust.arcgis.com is your one-stop resource for all security, privacy, and compliance information. It is now easy for you to get current information. The site provides transparency that inspires customer confidence. It includes centralized information for security updates, best practices, system availability, and status history.
ArcGIS Online is now security accredited and authorized for government use under the Federal Information Security Management Act (FISMA). FISMA Low accreditation ensures ArcGIS Online has been rigorously reviewed by a third-party assessor for alignment with stringent security requirements as provided by the National Institute of Standards and Technology (NIST), providing assurance for even commercial and international organizations.
As part of the ArcGIS Online privacy compliance with TRUSTe Certified Privacy Seal and US-EU/Swiss Safe Harbor, password requirements have been strengthened. Passwords must be at least eight characters long and contain at least one letter and one number. Passwords continue to be case sensitive. ArcGIS Online now supports identity provider (IDP) initiated enterprise logins in addition to service provider (SAP) initiated enterprise logins. You can now sign in with your enterprise login to apps purchased from ArcGIS Marketplace.
Analysis Tools
Tools for performing spatial analysis, which adds valuable insights into your data, are available through the map viewer and—for developers—through the API.
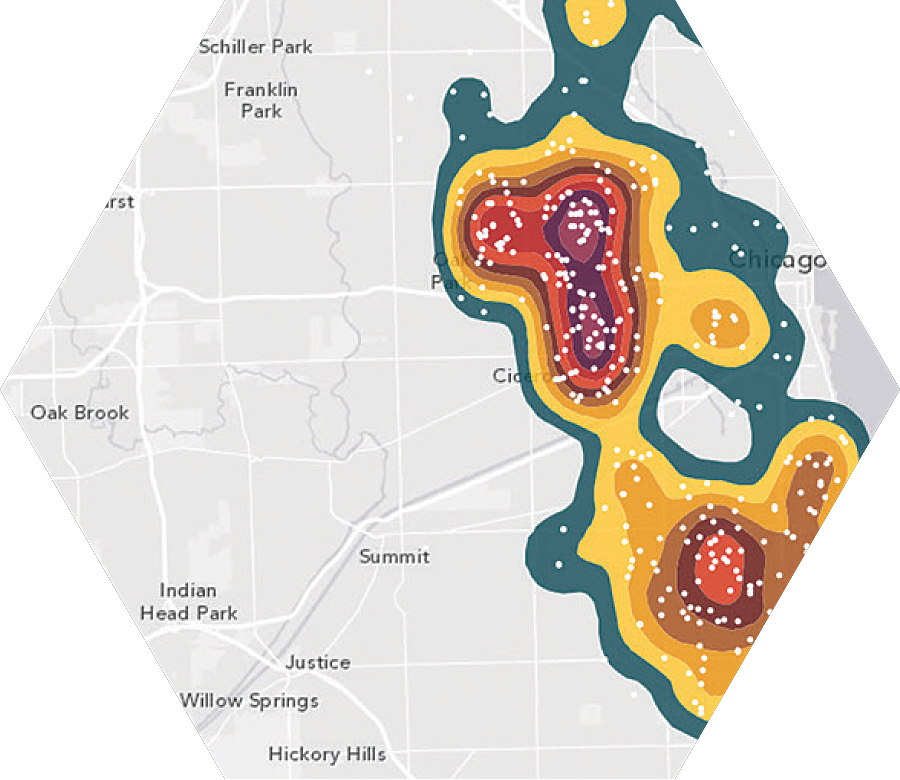
With the Calculate Density tool, estimate a density surface from point or line features. This tool returns areas classified by calculated density values such as crime incidents or risk of forest fires.
The new Interpolate Points tool lets you predict values at new locations based on measurements from a collection of points. For example, it can be used to predict pollution levels at locations that don’t have pollution measurement sensors.

With the new Plan Routes tool, determine the most efficient way to route a fleet of vehicles that make multiple stops.
A new data browser helps you search and select the data categories and variables using the Enrich Layers tool. Search for a variable by typing a keyword in the search box. The tool automatically sets the region based on your input data and keeps track of the number of variables selected. Twenty new countries have been added to the Enrich Layers tool.
Results for the Summarize Data tool now include charts. If you choose a field to group statistics, the results layer includes pop-up windows that show charts displaying related data as one-to-many relationships of the fields.
The Create Drive-Time Areas tool now offers three travel modes: walking, driving a car, and driving a truck that will show the areas that can be reached within a given time or distance using any of these transportation modes.
ArcGIS Content Updates
Living Atlas of the World is a rich catalog of thousands of maps, intelligent map layers, imagery, tools, live feeds layers, elevation services, and apps. Esri, its partners, and ArcGIS users around the world are contributing to this collection. Explore the Living Atlas in ArcGIS Online by going to the Ready-to-Use Maps page on arcgis.com. You can also access the Living Atlas through the latest version of Explorer for ArcGIS or by going to the Living Atlas web application.
National Geographic recently published an initial set of historical and reference maps from its extensive map archive that includes a mix of global and regional maps that span more than a century. The maps are high-resolution, georeferenced image tiles of maps originally published by National Geographic in its magazine or retail wall maps.
More than 175,000 historical topographic maps from the US Geological Survey (USGS) are also now available on ArcGIS Online. For over 130 years, the USGS has prepared these detailed maps to accurately show the complex geography of the nation. You can browse the National Geographic and USGS maps in the Living Atlas of the World.
The World Imagery map was updated with: SPOT, Pléiades, and DigitalGlobe imagery. SPOT imagery was added across Canada, the Nordic countries, Eastern Europe, the Middle East, and a few locations in Eastern Asia. The 2.5-meter resolution imagery is provided at the larger scales ~1:36 kilometer (k) to ~1:9 k. SPOT imagery will be published at larger scales for many other parts of the world in coming months.
Pléiades imagery was released for over 26 cities in the initial release. This submeter high-resolution imagery offers a more recent collection—within the last 18 months. Additional imagery covering approximately 350 urban areas globally will be released in the coming months. Both Pléiades and SPOT are products of CNES/Airbus Defence and Space.
Content from DigitalGlobe includes imagery updates for Abuja, Nigeria; Beirut, Lebanon; Brno, Czech Republic; Göteborg, Sweden; Port-au-Prince, Haiti; Recife, Brazil; Seoul, South Korea; Tunis, Tunisia; and a number of other locations around the world.
TerraColor 15 meter (m) imagery is now displayed globally, from ~1:591 m to ~1:577 k. Between ~1:288 k and ~1:72 k, the primary source is SPOTMaps 2.5-meter imagery where available, with other imagery at these scales from TerraColor.
Other updates to the World Imagery basemap include new community contributions from Bay County, Florida; Bismarck, North Dakota; Lawrence, Kansas; Erlangen and Hamburg, Germany; Quesnel, British Columbia, and a number of other Canadian cities. Updated content was provided for the State of Vermont; Langley, British Columbia, Canada; and many other communities.
Esri also recently published a new image layer featuring 1 m resolution, multispectral imagery for the continental United States, made available by the US Department of Agriculture Farm Service Agency. The National Agriculture Imagery Program (NAIP) acquires aerial imagery during the agricultural growing season in the continental United States.
The latest update to the World Street Map expands both content and coverage for North America. Commercial data was updated for North America. In the United States, for the first time, data from more than 100 communities received through the Community Maps Program was added. The Community Maps Program has expanded to include contributions to other basemaps in addition to the World Topographic Map.
New community contributions to the World Topographic Map for the US include King County, Washington; Crook County, Oregon; Los Angeles and Anaheim, California; Sparks, Nevada; Mesa and Queen Creek, Arizona; Mile High City, City of Aspen, and Pitkin County, Colorado; Teton County, Idaho and Wyoming; Oswego, Illinois; Plano and Montgomery County, Texas; Shelby County, Tennessee; Tampa, Florida; the City of Goldsboro, North Carolina; Milford, Connecticut; and others. Contributions from the international community include content for Denmark; the Island of Bermuda; Berlin, Germany; Vienna, Austria; Alberta, British Columbia, and Sudbury, Ontario, Canada; and others.
The Ocean Basemap now consists of two layers: a base layer with the hydrographic and terrestrial cartography and a separate reference layer that contains the reference information and labels, such as soundings, subsurface feature names, and administrative boundaries. As part of the Community Maps Program, OceanWise provided 6 arc-second, or approximately 180 m resolution data, for all of the British Isles.
The new Artic Ocean Basemap was released as a beta version in early July and is publicly available. It uses the Alaska Polar Stereographic projection (WKID 5936) and is cached from 1:451,295,122 down to 1:881,435. A beta version of Arctic Imagery in the same projection was also released.
For a list of all contributions, visit esri.com/contributors.

