case study
Moffitt Cancer Center's Strategic Expansion for Community Outreach and Research Using GIS Technology
Given the dynamic and evolving oncology health care landscape, understanding and defining service areas is essential for effective strategic planning of community outreach and research initiatives. The Office of Community, Outreach, Engagement, and Equity (COEE) at Moffitt Cancer Center, a National Cancer Institute (NCI) designated Comprehensive Cancer Center in Tampa, Florida, has embraced geographic information system (GIS) technology for this purpose. This initiative reflects an ongoing commitment to ensure Moffitt is reaching underserved populations in the catchment area with cancer education, screening, and research. It was particularly useful in the renewal of the Cancer Center Support Grant (CCSG).
COEE’s application of GIS began with a need to understand potential scenarios for expanding its catchment area—the geographic region from which the center draws its patients, conducts research, and conducts outreach activities. This was a strategic move, as at the time of expansion, 28 of Florida’s 67 counties were not included in the catchment areas of other academic cancer centers. As the only NCI Designated Comprehensive Cancer Center based in the state, Moffitt leadership saw the opportunity and need to expand its catchment area. The area needed to cover larger and more diverse populations, with the intent of enhancing equity and access to quality cancer care, cutting-edge research, the creation of mutually beneficial partnerships, and strategic outreach. By utilizing ArcGIS Business Analyst through ArcGIS Pro, COEE was able to visualize the geographic distribution of the populations and cancer burdens in current and expanded catchments. ArcGIS Business Analyst is a demographic mapping software that enables smarter site selection, market planning, and customer segmentation. Using this tool, COEE was able to compare population data to state and national levels, pinpoint underserved populations unique to its catchment area, and identify ideal locations for partners to help extend outreach and research opportunities.
Identifying and Supporting Vulnerable Populations
“As a senior leader within the organization, visualizations such as maps and infographics provided excellent tools to compare different options for expansion supported by data and combined with feedback from our engaged group of community and patient advisers,” said Susan Vadaparampil, Associate Center Director for COEE.
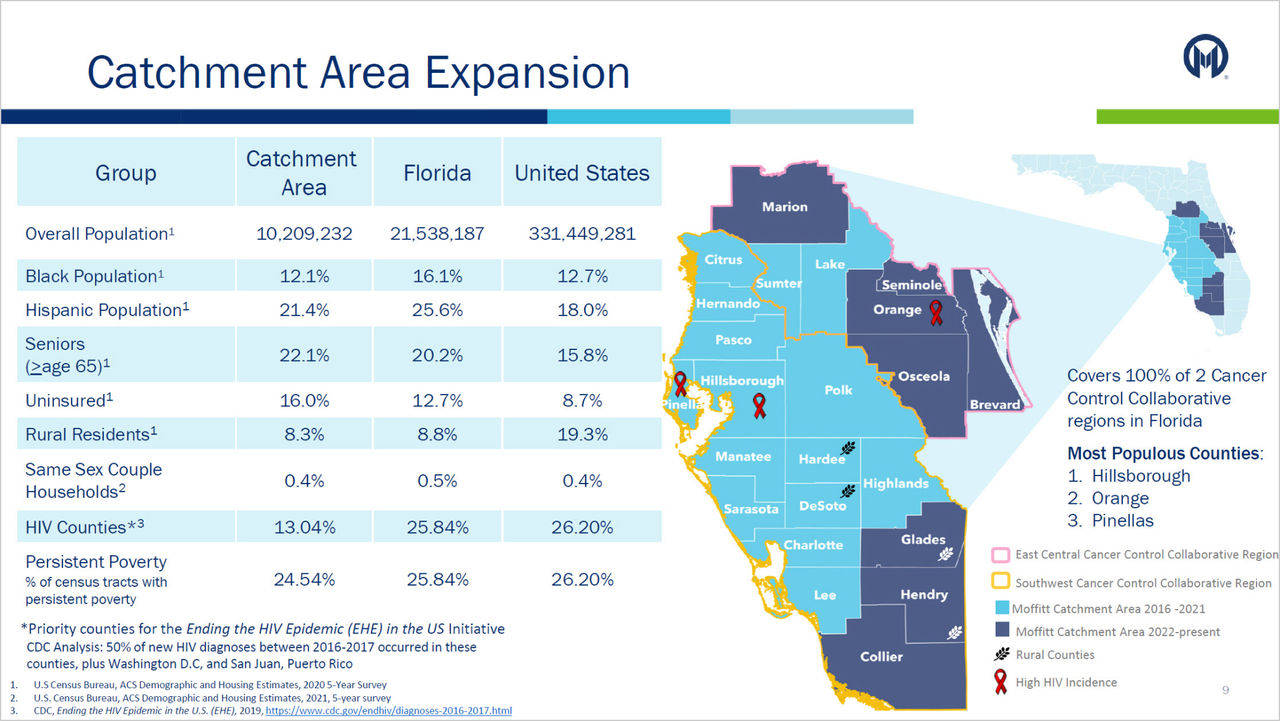
Significant emphasis was placed on making data-driven decisions, considering factors such as population growth, geographic coverage, overlap with other centers, priority populations, cancer burden, and Florida's existing Cancer Control Collaborative Regions (CCCRs)—regional partnerships aimed at strengthening cancer control efforts. Aligning the expanded catchment area with these existing CCCRs allows for sharing resources, enhancing the effectiveness of prevention programming, and extending outreach and research to address the unique needs of underserved areas within the state’s strategic framework and in geographically distant counties in the hospital’s catchment area.
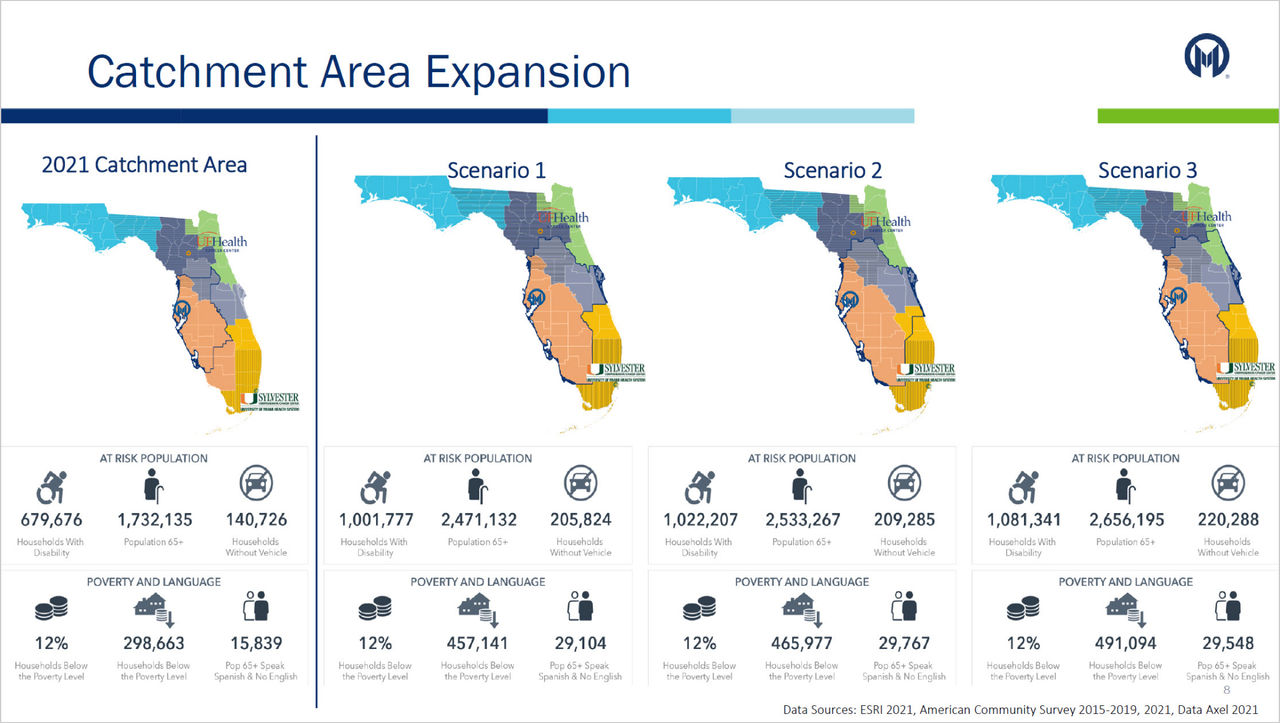
The Office of COEE began by establishing basic parameters, such as identifying contiguous counties and expanding into areas not served by other NCI-designated cancer centers. Data layering of these different options led to the selection of three scenarios with different combinations of counties. The next step involved enriching the data with geospatial insights, assigning demographic attributes such as education, income, or age to polygons based on location. This included an examination of a variety of data variables, such as underserved populations—which are populations that have historically experienced worse cancer outcomes compared to the general US population. These populations include Black and African Americans, Hispanic and primarily Spanish-speaking populations, individuals living with HIV, people age 65 and older, rural populations, and people living below the poverty line. ArcGIS Business Analyst enabled the integration and analysis of these diverse data points, allowing the COEE analyst to easily aggregate the data into different county scenarios. Leadership could then easily view the changes in demographics based on the different scenarios.
 Using ArcGIS Business Analyst, Moffitt overlaid multiple datasets to visualize and effectively communicate potential scenarios for service expansion to decision-makers.
Data Visualization Enhances Executive Buy-In
The use of GIS was transformative, not only in overlaying data and reaggregating data into various catchment area scenarios, but also in presenting data in a compelling and accessible format. ArcGIS Business Analyst allows users to create custom geographies, a key feature to the creation of the three catchment scenarios. Furthermore, it enables users to enrich data with a selection of over 15,000 data variables and compare geographies to observe differences. The resulting infographics played a crucial role in streamlining the decision processes. This approach saved countless hours of data collection and processing for each scenario.
 Data visualization allowed Moffitt to easily compare cancer burden across their catchment area with state and national rates. This provided Moffitt leaders with the necessary information to decide which geographic areas to expand into.
Building Partnerships and Community Networks
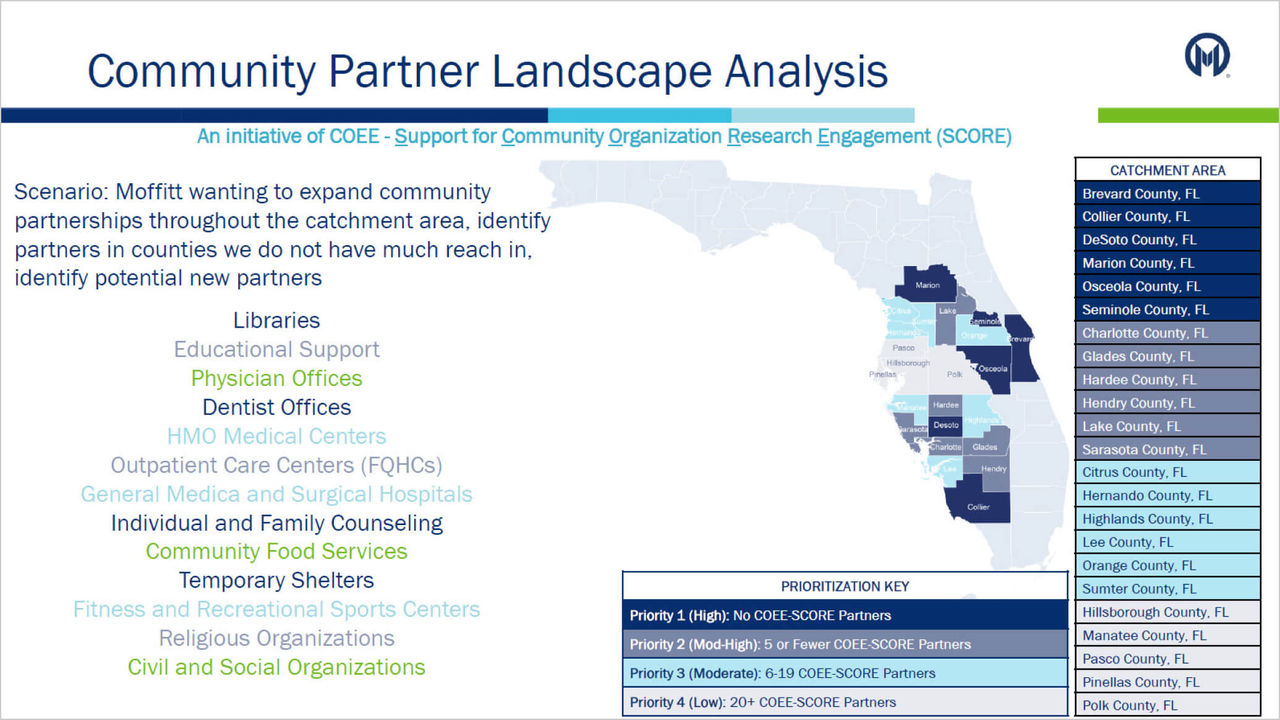
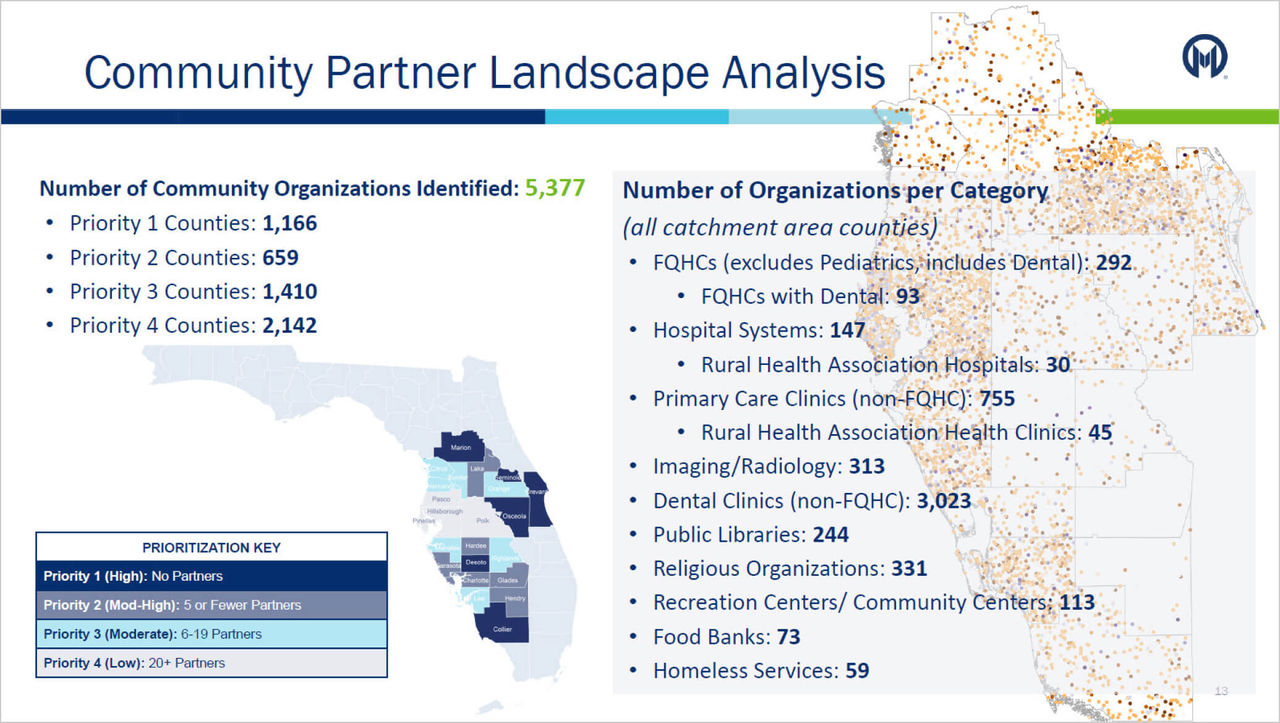
GIS was able to provide Moffitt’s research leadership with the data visualization they needed to make the crucial decision around expanding their catchment area, as well as enable them to identify gaps in community partners that could support Moffitt’s reach and planned growth. Using GIS improved efficiencies and allowed for a more strategic plan for recruiting the most relevant community partners for their network, particularly those who were geographically distant from the main location in Tampa. With ArcGIS Business Analyst, the Office of COEE was able to map potential community organizations within their newly expanded 23-county catchment area according to their North American Industry Classification System (NAICS) codes. This system supported a more targeted approach that could be used to establish meaningful partnerships to significantly extend their network with greater reach for screening and early detection education and for conducting research that addresses the unique cancer burden and disparities within the catchment area.
“This was much more efficient than a simple Google search,” said Nathanael Stanley, COEE Applied Research Scientist. “ArcGIS Business Analyst gave us a much larger jumping-off point for finding new partners because we didn’t start with a blank slate. Once new partners are identified, our COEE team can conduct targeted outreach to community organizations to formalize the new partnerships.”
 Step one in expanding community partners was to identify geographic gaps—key areas where there were too few partners to effectively support their growing network.
 The spatial analysis capabilities of ArcGIS have led to the identification of over 5,000 new community partners, significantly enhancing Moffitt’s outreach and impact.
Future Directions and Continuous Improvement
COEE’s strategic use of ArcGIS Business Analyst exemplifies how advanced technology can guide community outreach and research efforts. By integrating detailed geographic and demographic data, Moffitt has not only expanded its community outreach and engagement efforts but has also enhanced its ability to serve and impact diverse communities effectively through cancer control efforts and research.