"ArcGIS Monitor allows us to be able to notice when problems start, so we can then act to resolve the problem . . . with minimal to no interruption. That's something that historically we were not able to do without getting more of the insight that we have now."
case study
Engineering Firm Uses Metrics, Reports in ArcGIS Monitor to Optimize Enterprise GIS System Health
The multibillion-dollar construction industry continues to grow rapidly each year, fueled by investments in energy, transportation, housing, and manufacturing. With the need for sustainable design and architecture that protects natural resources and minimizes impacts on the environment, organizations like government agencies and professionals like city planners turn to environmental engineers and firms.
Challenge
Langan Engineering wanted a better way to monitor the health of their enterprise GIS system.
Solution
ArcGIS Monitor
Result
Using ArcGIS Monitor enabled Langan to be more proactive by improving the troubleshooting process, prompting team members to address technical issues more effectively.
Langan Engineering, headquartered in Parsippany, New Jersey, provides an integrated mix of engineering and environmental consulting services in support of land development projects, corporate real estate portfolios, and the energy industry. With more than 50 years in practice, the firm strives to contribute to the success of its clients by offering a range of services such as digital solutions, surveying, and sustainable design for projects in more than 100 countries.
The internal enterprise GIS system at Langan is composed of 7 to 10 ArcGIS Enterprise environments. This includes project delivery environments that the firm hosts and licenses for clients, as well as 20 to 25 servers. Troubleshooting technical issues presented challenges for the GIS services team such as manually checking every server when a problem occurred or scalability and performance issues due to Langan's growing number of web services.
Langan team members wanted a better way to monitor enterprise GIS system health and turned to ArcGIS Monitor, a solution designed for organizations to analyze and optimize the health of their ArcGIS Enterprise implementations. Monitor has enabled team members to proactively address technical issues, receive improved system metrics, and enhance system management, helping them deliver superior service to their clients.
Challenge
According to Chris Dougherty, a solutions architect at Langan Engineering, the firm has grown from providing hundreds to thousands of web services, catering to a wide range of usage levels—from high-demand to low-demand services. These services need to be accessible to staff and clients, which led to scalability and performance challenges. He explains that the organization's enterprise GIS was always designed for overcapacity to counter these issues, but the team had difficulty knowing what to scale and what usage was because of the limited metrics available.
Langan is an Esri partner. The firm leverages Esri technology and needed more specific performance metrics that classic IT monitoring tools couldn't offer. Dougherty adds that detailed metrics help the Langan team to understand what parts of the system to scale; for example, increasing memory or storage. However, with the intricacies of scaling an ArcGIS Enterprise architecture, the team wanted more specific metrics to better optimize its enterprise GIS.
"Statistics and metrics on what we have are extremely important to us to help us get a better picture. Being Esri specific is necessary because standard IT system monitoring tools don't show the whole picture," says Dougherty. "They'll show you throughput and RAM usage and things like that. But we really need service-by-service statistics."
Dougherty says the team has had ongoing technical issues, including exceeding the limit of ArcSOC processes. The team has 700 dynamic ArcSOC processes, though there is a limit of around 250 for the server, so the issue often caused the server to crash because it could not handle that much memory consumption.
Alex Bakhtin, senior solutions engineer at Langan Engineering, says when a technical problem occurred, such as a failed multimachine ArcGIS Server site upgrade, the team would need to check each server individually and review all log files in different locations because of the multimachine environment. The new solution would need to aggregate information from logs and provide notifications on system issues and health checks to streamline troubleshooting.
"We basically needed a product that allowed us to administer and manage a widespread enterprise GIS system like this one, that gave us more than what our internal software currently does, where it just lets us know when we have high CPU usage or when a service isn't running," says Bakhtin. "We needed more metrics and more insight."
Solution
The Langan team enlisted Esri Services to perform an architectural review of its enterprise GIS, to assess current needs and determine solutions, and ArcGIS Monitor was recommended as a solution. ArcGIS Monitor is an enterprise-grade monitoring solution that works with ArcGIS Enterprise by providing information about system health, usage, and performance. The team began using a beta version of ArcGIS Monitor 2023 and then deployed the final version after it was released.
Bakhtin says the setup was very simple because he only needed to ensure that he had the correct admin permissions, which were well documented, and he was able to easily register all the enterprise GIS components the team wanted to monitor. After the initial registration of ArcGIS Server, all the map services that the team published to it were immediately ready to view, which was a huge first step.
ArcGIS Monitor has enabled Langan team members to have a centralized location where they can more easily view and decode log files to resolve active issues. For example, when a server or service is down, and they determine that they're going to run out of disk space, they can talk to IT to get the space increased or perform a cleanup.
With Monitor, they are able to connect and manage all of their hosted enterprise environments, even if they are on other networks. Bakhtin says they can tie more of their disparate systems together, which has been a huge bonus.
Results
With improved data metrics and more efficient troubleshooting, the use of ArcGIS Monitor has enhanced operations at Langan and enabled the team to be more proactive. Bakhtin says previously team members found themselves reacting to every situation, and now with Monitor, they're able to prepare for and address technical issues.
"It helps with our problem-solving, being able to resolve issues when they do arise. Monitor is one of the first places to go—to be able to troubleshoot and get more of a single pane of glass in terms of your logs, your metrics, [and] what alerts there may be," says Dougherty.
Dougherty says Monitor alerts team members when a problem occurs, identifies what components are unavailable, and provides quick views of some common causes like storage space constraints. Before Monitor, they would have to sign onto multiple servers and access their respective logs, notes Dougherty. Now, the alerts help them identify the impacted server.
"You can very easily pinpoint where you need to start focusing when alerts occur, so they're more manageable to resolve during business hours. It allows us to really dig deep into the actual service itself and quickly identify what is the cause of that," says Bakhtin.
Bakhtin says Monitor allows the team to identify specific at-risk services and see where improvements are needed at the service level. The available metrics also let the Langan team check system health. Bakhtin likes that the metrics are accessible in one place, and anyone on staff can check reports or alerts for more information. He explains that the team can simply click on a link within a service to determine how to optimize it.
"We've been able to identify through Monitor why we are getting such high CPU usage on the server [or] seeing critical read errors for this specific map service. It just helps us identify among the thousands of services that we don't have any information on, which are the problematic ones," says Bakhtin.
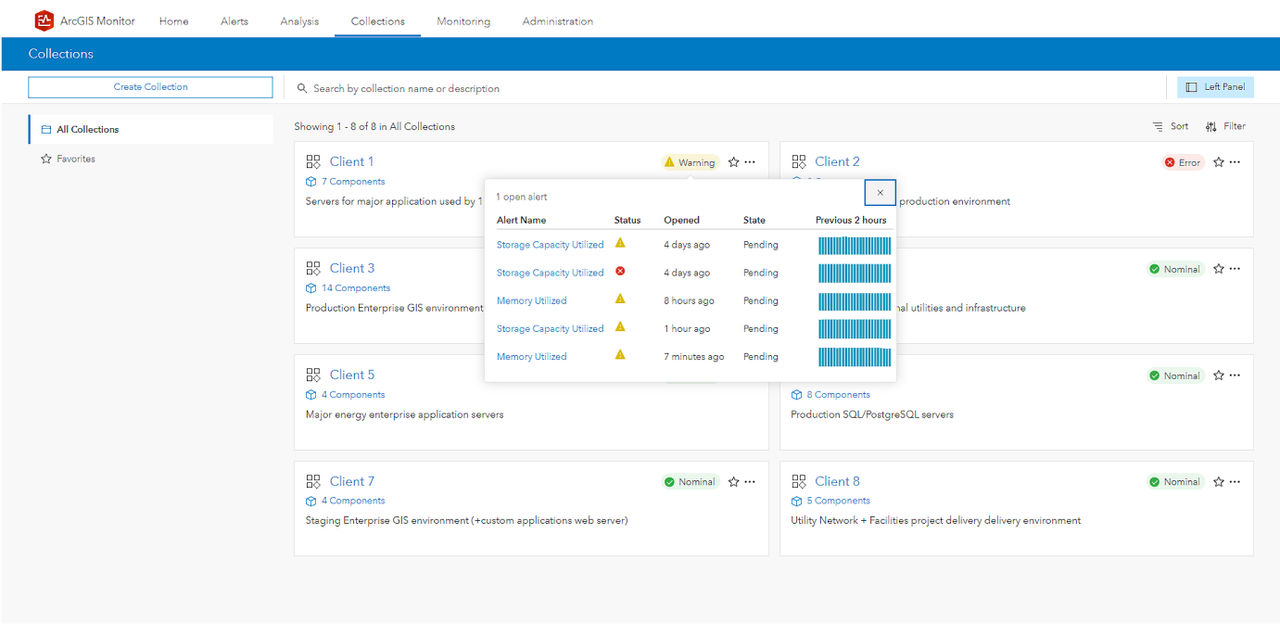
Collections are groups of components in a target environment, and these have been an important feature for Langan to monitor its parameters. Bakhtin says he and other members of the team can quickly tell what warnings are being triggered based on the different registered components, see the relevant alerts, and begin troubleshooting. They also set up collections for higher-priority systems that they want to keep a closer eye on.
"We have almost 2,000 components, and that's only going to grow. And being able to use these collections is very vital for us to be able to keep track and easily organize all the environments and systems that we have," says Bakhtin.
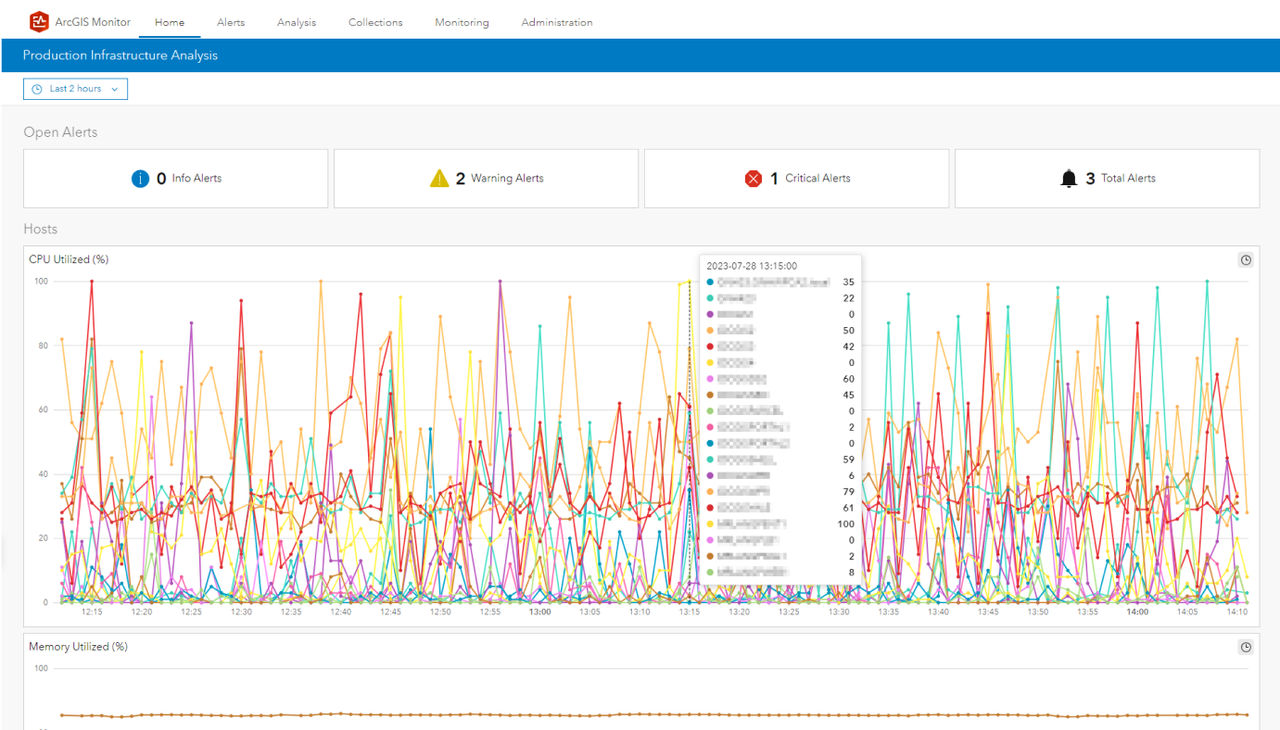
The Analysis views (i.e., reports) are used by Langan team members to better manage their system. It gives them a bird's-eye view of all their servers and what their CPU utilization is like as well as RAM, storage, and any open alerts.
"For organizations like us with lots of services from lots of places, things like [Analysis views] help us kind of tap into being able to optimize and get visibility into things we wouldn't normally be able to see," says Dougherty, stating that the Monitor reports provide highly useful information.
The ability to proactively address issues enables Langan to solve problems before its end users notice, delivering high-quality services and reliability to clients. John Young, practice leader and senior consultant at Langan Engineering, says Monitor has made the firm stronger and can help other organizations do the same.
"This is all about resiliency and risk reduction. I've reduced the time because I can spot something that's potentially a risk, and a lot of times I can fix it well before anybody would ever even know it's there," says Young. "I think a lot of organizations have a mandate to be more resilient, and this is a fundamental tool that's aiding that."