Analyze
GIS tools help you prepare data for mapping and analysis—from the simple to the complex—so you can answer your organization's most important questions. GIS data management capabilities empower you to visualize, enrich, and model your data.

Understand your community to design an equitable transit system
Public transportation professionals know that equitable and safe access to transportation is a right of all community members. GIS provides powerful analytical and mapping tools to help you achieve transit equity. Better understand community needs and mobility requirements, improve project prioritization and transit access in neighborhoods, and design effective services to deliver equitable transportation resources to all.
GIS tools help you prepare data for mapping and analysis—from the simple to the complex—so you can answer your organization's most important questions. GIS data management capabilities empower you to visualize, enrich, and model your data.
Powerful analysis tools and map styles help you discover and refine your data's story. Enrich maps with content from Esri's vast data library and personalize them with custom symbols and unique basemaps. Share these vivid maps to influence change.
Governments and residents rely on each other to meet the community's needs and shape its future. GIS technology provides an opportunity to evolve how governments communicate with the community by using powerful tools to advance racial equity in transit.
Discover how GIS can foster a better understanding of your community's transportation needs and help you design and build a more equitable transportation system.
Understanding precedes action. Gaining deeper knowledge about your community is necessary to enhance service and advance racial equity in transit. Identifying where economic and mobility challenges occur is a first step in addressing equity. Esri's rich data sources can help you analyze specific populations in your community. GIS tools allow you to visualize factors such as where low-income seniors, residents in severely rent-burdened households, and people with disabilities live. GIS is a connected technology that helps you strategically address residents' needs through an equitable lens.

Solutions that address equity will be unique to each community. GIS is not a one-size-fits-all technology; it is nimble enough to help you build social, racial, and economic indexes designed to address equity issues in a specific community. Whether issues relate to urban displacement, poor air quality, safety, or lack of mobility options for getting to schools and jobs, GIS can help you create comprehensive measures designed to make transportation systems more inclusive, and better meet the needs of everyone in the community.

GIS provides a comprehensive analysis of your community, so you can understand priority areas and accessibility to existing services. Use that insight to design tailored services that foster a more inclusive community transportation system. Achieve community equity goals to ensure that everyone has access to dignified, frequent, and affordable transportation.

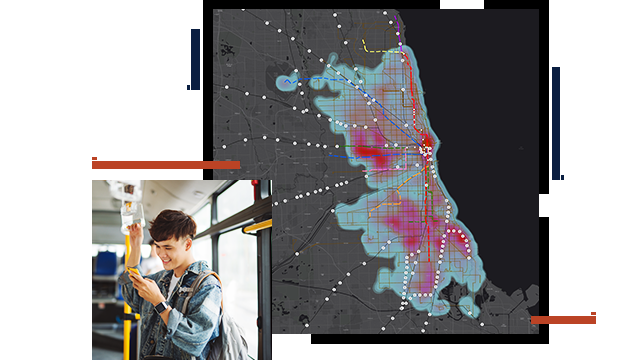
The Chicago Regional Transportation Authority (RTA) used GIS to understand and fulfill riders’ needs while enhancing the services they provide.
SFMTA leveraged GIS to develop the SFMTA Equity Toolkit, which was designed to help transportation professionals address social and economic issues.
Case Study
Centralina Regional Council and Charlotte Area Transit System use GIS to facilitate transportation and access to services in a diverse region.
USER STORY
City of Oakland uses GIS to surface, share, and act on inequities that Black, Indigenous, and People of Color (BIPOC) face.
BLOG
Governments have a new way to understand community characteristics, analyze community conditions and actions, and generate an equity analysis index.
Webinar
GIS helps leaders understand travel behaviors and evaluate accessibility to help define a more equitable distribution of transportation resources.
Use this network-based spatial analysis tool for solving complex routing problems. Accurately represent unique network requirements.
Get location-aware data visualization and analytics for a real-time operational view of people, services, assets, and events.
Combine demographic, business, lifestyle, spending, and census data with map-based analytics to make better planning decisions.
Understand community characteristics, analyze community conditions and actions, and generate an equity analysis index.