
Visualization and analysis for meteorology
WEBINAR
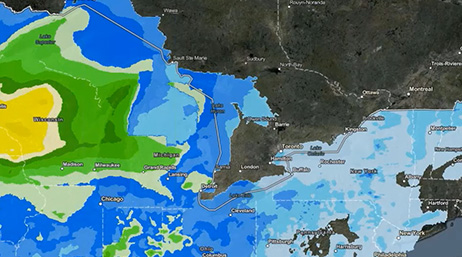
Learn how GIS helps you visualize and analyze temperature and precipitation changes, monitor stationary sensors, and respond in real time.

Discover new insights, innovative best practices, and the latest advancements in GIS technology.

Visualization and analysis for meteorology
WEBINAR

Climate risk analysis using GIS
WEBINAR

Weather and climate data dissemination
WEBINAR

Hydrologic models to aid forecasts and projections
WEBINAR
Deliver analysis-ready data
WEBINAR

Field Operations and Data Collection
WEBINAR

Capturing Reliable Data in the Field
WEBINAR

Mapping and visualization to influence change
WEBINAR

Data visualization to perform analysis in ArcGIS
WEBINAR
Speak with a representative.