Over the next few days, many of us in the GIS community will be asked, “What is GIS?” To help make the answer simple, I thought we can use the example “Imagine we needed to bring internet to Santa’s workshop at the North Pole. How would we even start?”

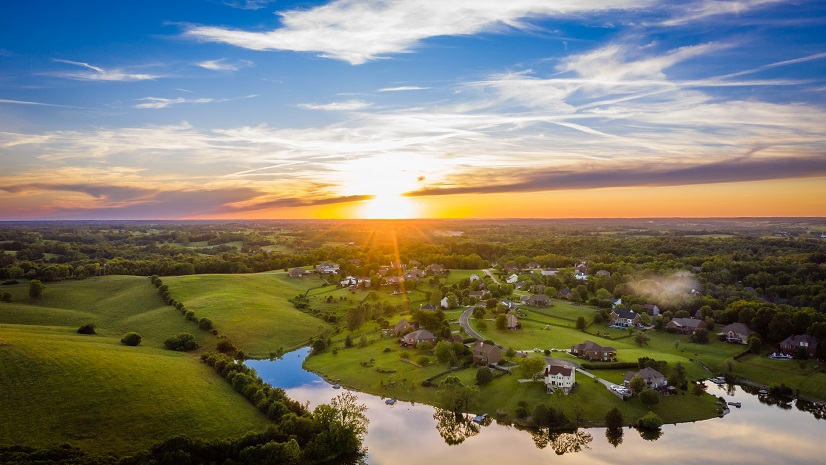
Simply put, Santa’s workshop is a lot like a rural community that’s far from big cities. It’s remote, surrounded by challenging terrain, and has unique needs. On the outside, it might look magical with candy-cane columns and twinkling lights, but inside, I’m sure it’s a highly advanced global operation. Everything runs on automation, robotics, and lots of data. Just like how any modern businesses in rural areas depend on reliable internet to grow and thrive.
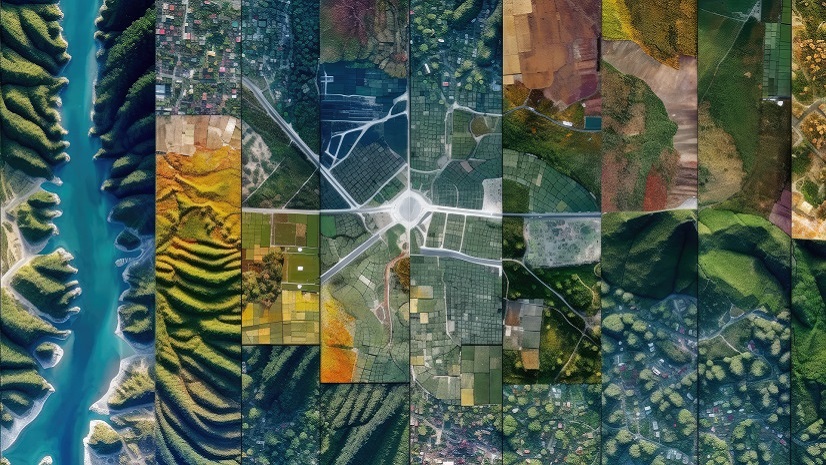
If we were building a network for Santa, or we were delivering broadband to remote places, we’d need tools to map the land, plan the routes, and make sure we don’t disrupt the environment. GIS would help us figure out property lines, find stable ground, and avoid sensitive areas. It would also help us plan efficient routes for construction and make sure the network serves everyone equally.
Just like connecting our own rural communities, bringing internet to Santa’s workshop would be a big challenge. But with GIS and tools like Esri’s Living Atlas, it’s possible to quickly gain the insight and understanding we need to create networks that connect even the most remote places.
Looking deeper, here’s how we’d approach bringing broadband connectivity to Santa .
Building in a Remote and Sensitive Environment
Building a fiber optic network to one of the most isolated places on Earth requires addressing both environmental and logistical challenges. The unforgiving Arctic terrain presents numerous obstacles, demanding careful planning and the use of precise GIS data to mitigate risks and navigate constraints.
Parcel Data for Land Use and Ownership:
Parcel boundaries and zoning information from the Living Atlas allow us to identify viable construction sites and avoid conflicts with protected land. These datasets are instrumental in aligning a project with arctic land use policies. Without accurate parcel data, the permitting process could drag on for months, delaying the entire project. By knowing exactly where we could build and understanding land access rights, we can streamline the process, ensuring timely progress along the network route.
Geology and Soil Data:
The Living Atlas provides critical subsurface geology and soil type data to assess land stability. Identifying areas with solid bedrock reduced the risk of infrastructure failure caused by unstable terrain or frost heaves. Furthermore, these datasets allow the ability to anticipate potential hazards, such as soil erosion or landslides, and avoid them during construction. In many cases, this proactive approach can not only save time but also significantly reduce costs by preventing costly repairs down the line.
Topography and Elevation Data:
High-resolution digital elevation models (DEMs) and topographic maps help map the most efficient cable routes, avoiding steep inclines and areas with difficult terrain. These tools also enable us to predict where natural water runoff might pose challenges, helping us design infrastructure that was resilient to the Arctic’s unpredictable conditions. By planning with elevation data, we can ensure that infrastructure avoids flood-prone regions while optimizing signal propagation for the network.
Planning the Network with GIS
Using Esri’s Living Atlas, we can devise a detailed, data-driven plan for Santa’s network connection. Every aspect of the planning phase will leverage the power of GIS to ensure the project’s success while minimizing environmental impact.
Land Cover and Use Data:

Layers detailing vegetation, urban areas, and waterways can help us design routes with minimal environmental disruption. Avoiding dense vegetation and water crossings reduces both costs and environmental impact. These insights allow us to create a network plan that respected the Arctic’s delicate ecosystem while meeting our technical requirements. Urban and land-use pattern analysis helps to integrate the network with existing infrastructure efficiently, saving time and resources during deployment.
Demographic and Socioeconomic Data:
By leveraging population density and community facilities data, we can ensure equitable service distribution. High-demand areas near Arctic research stations and indigenous communities can be prioritized, ensuring the network will serve as many people as possible. Additionally, socioeconomic data provides insights into future growth areas, ensuring that our network design will accommodate expanding demand over time. This approach not only enhances immediate impact but also helps make the project scalable and sustainable.
Transportation Networks:
Information on Arctic roads, railways, and waterways helps us better understanding planning construction permitting needs. Furthermore, by utilizing existing transportation corridors, we reduce the need for creating new paths, saving time and resources. These datasets can help us gauge permitting costs and establish smooth logistics for moving equipment and materials to remote sites.
Utilities Infrastructure:
By partnering with local utilities, we can integrate and leverage their GIS layers showing electric, gas, and water utilities to help our team make informed decisions on network placement. Where possible, leveraging existing utility poles will expedite network buildout and environmental impact of newbuilt underground construction.
Environmental Sensitivity and Climate Considerations
Protecting the Arctic’s fragile ecosystem was a top priority. GIS tools and Living Atlas data provides invaluable guidance to help us navigate sensitive areas and plan our construction activities responsibly.

Environmental Sensitivity Areas:
Layers identifying habitats of endangered species and protected zones will help us avoid critical areas, such as polar bear migration paths and key breeding grounds. These insights can ensure that our project adheres to environmental regulations while minimizing ecological disruption. By adjusting routing decisions based on sensitivity data, we can maintain a balance between development and conservation, setting a precedent for sustainable infrastructure planning in remote regions.
Climate and Weather Data:
Predictive weather models and historical data will help us create our construction schedules, allowing us to avoid periods of severe storms or extreme temperatures. This can not only keep the project on track but also ensure our teams are working safety during operations. Long-term climate projections will also be considered to ensure the infrastructure is designed to withstand future conditions, such as thawing permafrost or increased precipitation. This forward-thinking approach will help ensure the network’s resilience for decades to come.
Infrastructure Implementation while Navigating Obstacles
To overcome challenges in the North Pole’s unique landscape, we can rely on a variety of GIS layers to help us optimize both construction and network performance. The insights provided by the Living Atlas can empower teams to navigate obstacles with precision and efficiency.
Obstacle Data (Built and Natural):
The Living Atlas’s obstacle datasets can help identify potential signal obstructions, including structures and dense vegetation. Adjustments can be made to during planning to maximize signal propagation while minimizing the need for additional infrastructure. Natural barriers, such as mountain ranges and ice formations, can also be accounted for in route planning to prevent unnecessary risk to safety and expenses. These considerations are crucial for ensuring uninterrupted connectivity throughout the Arctic.
Wireless Spectrum Availability:
Wireless availability datasets can help guide the placement of cellular networks to avoid coverage gaps and maximize network efficiency. In areas with limited wireless availability, fiber infrastructure can be prioritized to ensure robust connectivity. This strategic deployment approach balances immediate needs with long-term goals, creating a network that is both reliable and scalable.
A New Era for Santa’s Workshop
Once connected and operational, the fiber optic network can help transform Santa’s already impressive workshop into an even more efficient technological marvel. The benefits will also extend well beyond the workshop itself, and positively impact Santa’s global operations and team communication.

Production Enhancements:
Real-time monitoring of production lines allowed elves to maximize efficiency while maintaining quality standards. ArcGIS dashboards will help Santa track performance metrics across the North Pole, enabling proactive adjustments to maintain peak productivity. This technology integration not only improves operations but also sets a new benchmark for advanced toy manufacturing.
Global Toy Delivery Optimization:
Santa’s sleigh, now equipped with a GIS-enhanced network operations center, can utilize real-time weather and air traffic data to optimize its Christmas Eve route. This ensures timely deliveries to children worldwide, even in the face of unpredictable Arctic weather conditions. The integration of GIS tools into delivery operations revolutionizes Santa’s traditional logistics, making them faster and more efficient than ever before.
Direct Communication:
Leveraging features of ArcGIS Online, Santa’s new network can help enable secure communication portals for children to send their wishlists directly to Santa. This direct line to Santa creates a more personal and efficient system for managing holiday requests, delighting children and parents alike.
In Summary
Building a fiber optic network to Santa’s workshop is a lot like bringing broadband to a rural area, one full of challenges and community rewards. Just like in real-world projects, if we had to build to the North Pole, we’d have to deal with tough terrain, tricky logistics, and environmental concerns, all while making sure the local community’s needs along the way were met. The example of building broadband to Santa’s workshop helps highlight what’s possible when we need to connect the most remote places. Using resources such as the Living Atlas of the World for data such as property boundaries, soil, topography, and sensitive environments, this story highlights how modern technology can helps teams deliver networks anywhere in the world if you plan it right.
For telecom companies, with the right tools you can truly transform rural communities. Just like how Santa’s operations got a major boost from new technology, similar projects can open doors for education, business, and communication in underserved areas. I hope you agree, this project example showcases how GIS tools can help providers deliver networks that help create strong, reliable networks that make a real difference. If you want to close the digital divide and bring high-speed internet to the hardest-to-reach places on earth, we’re here to help.
Learn More
Reach out to us today to learn more about how Esri’s products and resources can help your organization tackle complex challenges, connect communities, and create lasting impact. Let’s work together to make your next project a success.


