Many times in this space, I have stated how inspiring it is to see the continued rapid integration of GIS into the planning profession. This feeling is deeply rooted in the early days in my career when GIS “integration” was the planner standing over my shoulder and directing map production. I still occasionally hear, ”No, Keith. We need a lighter shade of yellow for low-density residential” in my sleep. Today, you don’t have to look hard to see numerous examples of how far GIS has come from being a niche technology to a mission-critical business system in planning departments across the globe. This is certainly not an all-inclusive list, but I hope these examples will provide inspiration and ideas for you in 2023.
3D is How Planners Think, Design, and Analyze
3D is no longer a luxury. It hasn’t been for the last decade. Obtaining 3D basemaps and designing developments in 3D are more attainable in more platforms than ever. I have cities and counties sending me their stories of how a district or an entire community was redesigned in a 3D environment. It provides a realistic way for planners, developers, administrators, and the public to view the impacts of a proposed development using real metrics.
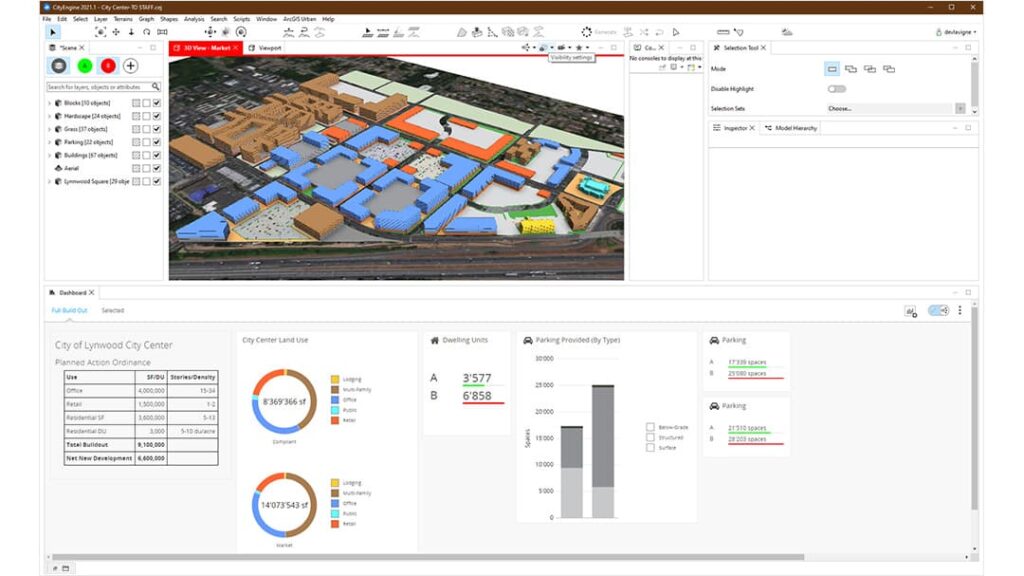
A great example of this at work is Lynnwood, Washington. In December 2019, Lynnwood’s city council approved Northline Village, a high-density mixed-use residential complex, in anticipation of increased housing demand spurred by the announcement of the new Lynnwood Link rail station. To assess the impact of the new Northline Village development on the remaining, undeveloped portions of the City Center, Lynnwood sought the expertise of Esri partner Houseal Lavigne, a firm with digital twin and smart city experience. Houseal Lavigne’s approach would leverage the city’s existing GIS information and data to analyze and model—in 3D—two different scenarios. One was compliant using the city’s existing development parameters. Another was realistic in creating denser development.

The two models, both created in ArcGIS CityEngine, and the dashboards made it possible for Houseal Lavigne to show the City of Lynnwood how the current building development maximum would curb redevelopment of the City Center area.
Civic Inclusion is the Evolution of Traditional Public Engagement
In the past, engaging the public for planning departments meant that oh-so-attractive re-zoning sign placed on a property, a planning commission meeting, or a town hall meeting. Civic inclusion moves beyond that dated approach towards a genuine partnership with the public. It provides modern ways for a greater number of people to understand proposed changes and voice their opinions. Just because someone can’t be at an in-person meeting doesn’t mean they don’t care about the direction of their neighborhood. GIS is at the center of civic inclusion because geography is at the center of planning.
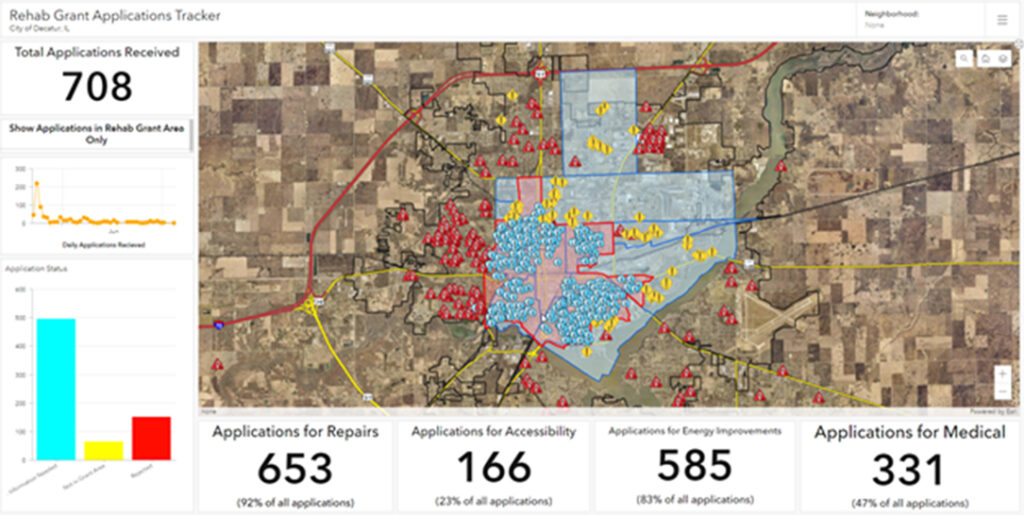
Decatur, Illinois wanted to focus on remediating blighted neighborhoods that had not been addressed during the downtown revitalization project a few years prior. This accounted for around a third of all properties within the city. City leaders found an opportunity to remedy this with the release of American Rescue Plan Act of 2021 (ARPA) funds, specifically, the State and Local Fiscal Recovery Funds (SLFRF) through the US Department of the Treasury. About $5 million of the award was set aside specifically for residential rehabilitation grants, which can be used by individual homeowners or landlords. GIS was used to engage the public to find out where the funds were needed the most. The city deployed ArcGIS Survey123 to allow residents to quickly and easily apply for money to rehabilitate their homes for projects such as a new roof, air conditioning, accessibility improvements, and structural repairs. By the end of the first week, they had over 400 applications from property owners.

To organize these surveys, the city created an ArcGIS Dashboard to convey the applications to city leaders. GIS will be used in the next phase of this project to track project status at properties across the city.
Creating Denser Developments is Feasible with the Right Tools
Changing demographics and demands for housing provide a new challenge for many planning departments. This is one of the reasons why zoning reform has been (and will continue to be) a subject moved to the center stage at many cities and counties. Saying you need denser development is less effective than helping residents visualize and analyze these proposed developments, so that they can see the impacts and benefits of them.
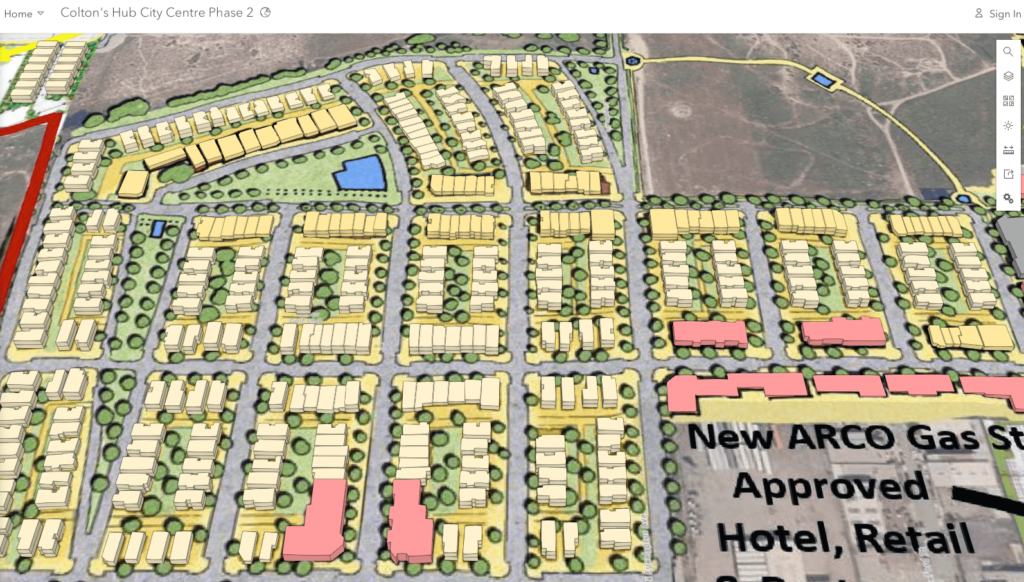
In Colton, California, the city aims to reimagine its future through the creation of Hub City Centre, a marketplace inspired by the vibrant mix of live, work, shop, and play amenities of Santa Monica’s Third Street Promenade to deliver commercial and residential growth. Using ArcGIS Urban, they built a 3D model of planned and existing development at the center, demonstrating how the mostly barren land could flourish into a lively community space. By creating a digital twin of Colton, city leaders could visualize the Hub City Centre plan with the proposed additions of housing, nature trails, restaurants, entertainment, parking, and other features. The townhomes (built at 25 units per acre) have been selling quicker than expected and multiple retailers have already signed on, based on the 3D models (and corresponding metrics) that have been created.

In State College, Pennsylvania, the Planning Department has successfully implemented ArcGIS Urban to demonstrate the impact of proposed denser residential and mixed use developments in a borough that is constrained by geography. In addition, they’ve been able to make these developments available to the public for review. All stakeholders can visualize the existing and proposed developments together to offer input about the best path forward for this college town.
And finally…
AI is Knocking at the Door
Ok, not literally. But, if you the only things you think of when you hear artificial intelligence is HAL 9000, K.I.T.T. (I won’t apologize for an 80’s reference), or SkyNet, you need to update your stance. AI is already in place in more ways and in more devices than you likely realize. Planners need to be prepared for what AI can do and how it can help them do their jobs better. APA put out a very useful resource called AI in Planning that is a must-read for planners in 2023.
If these stories seem overwhelming or unattainable for you, they shouldn’t be. None of these projects were completed by agencies with unlimited resources. If you need to know how to get started, please reach out to me or your Esri account team…or just start at esri.com/planning.
And, in a shameless plug, please subscribe to our new podcast, Reinventing Planning, available wherever you get your podcasts. Happy New Year!


