United States utilities collectively manage over US$1.25 trillion worth of water, wastewater, and stormwater assets. This includes an estimated 4 million miles of distribution and collection pipe, 77.5 million network assets, and nearly 300,000 vertical assets.
Effective management of utility infrastructure management requires operators to think holistically about their networks. Operators need to not only know where their critical assets are but also understand the connections and relationships between those assets. In the event of a water main break, which valves should be closed to ensure that service disruptions impact the fewest customer households and businesses? In the event of a power outage at a wastewater lift station, which maintenance holes are at greatest risk for a sanitary sewer overflow? When catastrophic weather impacts a water treatment plant, how do the power, communications, heating, and water networks interact and influence each other to help head off cascading effects?
Managing assets as part of a network enables utilities to better understand and improve performance. Mapping assets and recording their key attributes—size, age, material type, etc.—are among the core functions of a geographic information system (GIS). Esri’s ArcGIS enables mapping with easy-to-use applications and advanced network management and modeling tools. These tools provide web-based networking capabilities that are designed to work on a smartphone as well as they do on a desktop computer. Teams across the organization, from the office to the field, can easily access information whenever they need it.

San Juan Water District (SJWD) in Granite Bay, California, needed a new solution after losing support for its legacy open-source GIS. The loss of their GIS made data sharing across systems and departments more difficult and forced SJWD to return to using costly, inefficient paper map books.
With the help of Esri partner HDR, SJWD implemented ArcGIS. Using existing CAD data and county parcel drawings, SJWD built an accurate and robust system of record for the utility’s water distribution network assets.
San Juan Water District operators use Esri’s advanced network modeling, management, and tracing capabilities to identify system and customer impact during outage events. Engineering and operations teams are now proactive in determining areas exposed to potential vulnerabilities. This has saved countless hours compared to manual, paper-based processes. SJWD has built GIS-based repositories that bring together distribution and treatment asset data, customer and work order data, and county parcel and demographic data. Leveraging integrations with asset management and customer information systems ensures that key organizational information is accessible to all staff members. Improved communication between different business groups and integrated work processes have increased SJWD’s engagement and awareness. This has empowered the utility to quickly react to system requirements and customer needs, improving its daily performance and preparing for the future.

The Public Works Department at the City of Provo, Utah, upgraded to ArcGIS Utility Network to support updates to its comprehensive plan. In the past, staff had to manually identify pressure zones, watershed areas, and sewer management areas. This process was tedious and time-consuming for the team, who would spend hours manually tracing the extents of each zone and populating attributes on the corresponding features. Manual processes also increased the likelihood of data errors. Because many of these processes are tied to permitting or regulatory processes, it is especially important that the data is accurate; otherwise, it can lead to slow and costly audits.
The City of Provo implemented ArcGIS Utility Network for its water, wastewater, and stormwater systems. Utility Network improved data quality, and each system was accurately modeled. Automated data validation tools ensure that data quality is maintained. The network models are now accessible at every level of the organization.
With ArcGIS Utility Network providing service-level access, we have put accurate data into the hands of more users at all levels within the organization to increase vested interest in the data as well as the value from the data. This helps us tremendously as a data-driven organization. – Kalvan Hone, GIS Coordinator, City of Provo
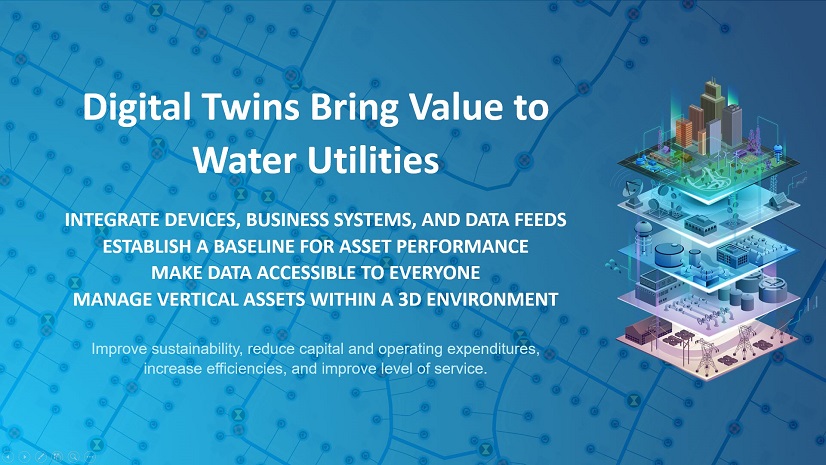
ArcGIS and Utility Network promotes modern network management practices and provides the foundation for creating a digital twin of a utility’s infrastructure. Improved data design enables utilities to model their assets in detail while maintaining a highly performant web-based GIS experience for end users. Next generation analysis tools provide enhanced capabilities for tracing and visualizing network information. Analysis results and asset information can be shared across the entire organization in real time. This provides an up-to-date and accurate operational view of the system, enabling more efficient workflows and better decision-making.
Download Understanding the Utility Network: A Guide for Water Utilities to learn more.


