Throughout my career, people have often asked me, “What can I do to help my community?” “What can I do to ease my anxiety about the state of the world?” “How can I utilize my GIS skills to advocate for justice?” Over ten years later, my answer remains the same: contribute your time or resources to help your community. One of the best ways we can all work toward improving the communities we live in is by connecting with local nonprofits and community-based organizations.
Before joining Esri, I worked with the nonprofit Dolores Huerta Foundation (DHF) to create their GIS redistricting program. As someone who volunteers with nonprofit organizations during my free time, I know the power and influence of local nonprofit organizations and their ability to distill complex information to mobilize the community. Civic nonprofit organizations have been at the forefront of equity, social justice, and transformative change for decades. To further their reach and impact many organizations are beginning to utilize geospatial thinking and technology to pursue social justice in their communities. For example, the Cesar Chavez Foundation, National Association for the Advancement of Colored People (NAACP), and Planned Parenthood all leverage GIS tools to advance their work.
Nonprofits and civic organizations are mission-driven by nature, and many of these organizations are at the forefront in addressing inequities. As the National Council for Nonprofits says, “Nonprofits play a fundamental role in creating more equitable and thriving communities.” Nonprofit organizations are not dedicated to private or financial gain, but to the advancement of public interest.
This year, we are launching a blog series focusing on civic nonprofit work that advances equity and social justice by leveraging GIS tools. Highlighting four steps nonprofits can take to utilize GIS to enhance their advocacy work:
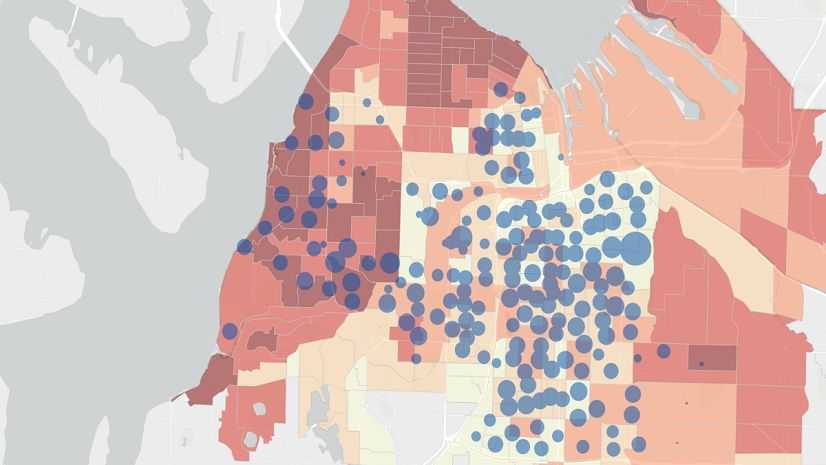
1. Communicate Your Cause: GIS allows organizations to visualize and analyze spatial data, which can be used to create compelling maps and visualizations that convey their mission, impact, and the issues they are addressing.

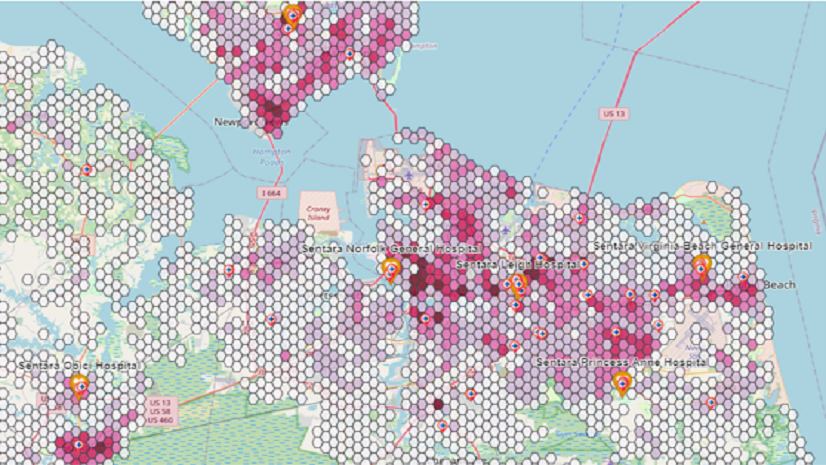
2. Understand Your Community: Communities are complex, with social, economic, and environmental factors interconnecting in unique ways. Seeing and understanding communities through the lens of where they are located can reveal patterns and relationships.

3. Act On Your Mission: Nonprofits are operating at many levels to solve complex world challenges and GIS is providing the framework and tools for tackling them at every level, as well as ensuring positive practice when it comes to incorporating equity into decision making.

4. Measure Your Impact: Achieving equity takes time—especially when you consider demographic and socioeconomic factors. Use location-based data to measure your success and uncover opportunities to redirect efforts. Organizations that achieve equity monitor decisions and policies with real-time GIS, make necessary adjustments to their strategy, and apply appropriate resources where they’re needed.

Nonprofit organizations are becoming bigger users of GIS technology, and their work is more vital than ever. Keep an eye out for our next blog and sign up for our equity newsletter to receive GIS for Equity updates https://go.esri.com/EquityNonprofit