Homelessness is a complex issue that affects communities worldwide. Conducting accurate and comprehensive Point-in-Time (PIT) counts is crucial for understanding the scale of homelessness and developing effective strategies to address it. In this blog post, we explore the valuable lessons learned from Esri’s support of a recent large scale homeless PIT count. By applying Esri’s expertise in data collection, analysis, mapping, visualization, and planning, we aim to help organizations streamline their annual PIT counts and make informed data driven decisions.
1. Planning a safe and efficient PIT Count requires modern GIS approaches
Planning for a PIT Count is inherently geographic. During the planning process, it is common to divide the geographic area to be counted into “sections”. Some organizations plan for complete coverage and others plan for covering known hotspots where people experiencing homelessness may typically be found. This geographic information is crucial for determining the areas that need to be covered during the count and for organizing volunteers and resources effectively.
GIS enhances Safety of PIT Counts. Safety is also a major concern during PIT counts in both rural and urban areas. In rural areas, safety issues may arise due to the remote locations of encampments, such as lack of communication or being far from police stations. In urban areas, abandoned buildings can pose structural risks or be used for illegal activities. It is helpful to visually represent known unsafe locations on a map such as freeways, abandoned buildings, waterways, and wooded or forested areas. These known unsafe locations should be handled by specially trained individuals.
2. Volunteer Recruitment, Coordination & Training Key to PIT Count Success
PIT counts require more than an app for digital data collection and dashboard for visualization. Most PIT counts require volunteer recruitment, training, and coordination efforts. Volunteers contribute to the overall capacity of the count, allowing for greater coverage of geographic areas. Additionally, communities view the event as an opportunity to educate the public about homelessness and foster collaboration among people from diverse backgrounds. These volunteers are recruited from various sources and are typically provided with training.
Engage and coordinate potential volunteers. ArcGIS Hub can be used to create dedicated websites to engage with potential volunteers. Organizations can provide information about the homeless count initiative, the importance of volunteers, and the specific roles and responsibilities they will have. GIS tools also provide features for volunteer registration, communication, collaboration, and reporting.

3. Organizations require different solutions based on the type of count they are conducting:
The U.S. Department of Housing and Urban Development (HUD) recommends two main data collection methodologies for Homeless PIT Counts: Street Count and Demographic Interviews.
Street Count: This methodology involves counting individuals experiencing homelessness who are found on the streets, in parks, or other public spaces.
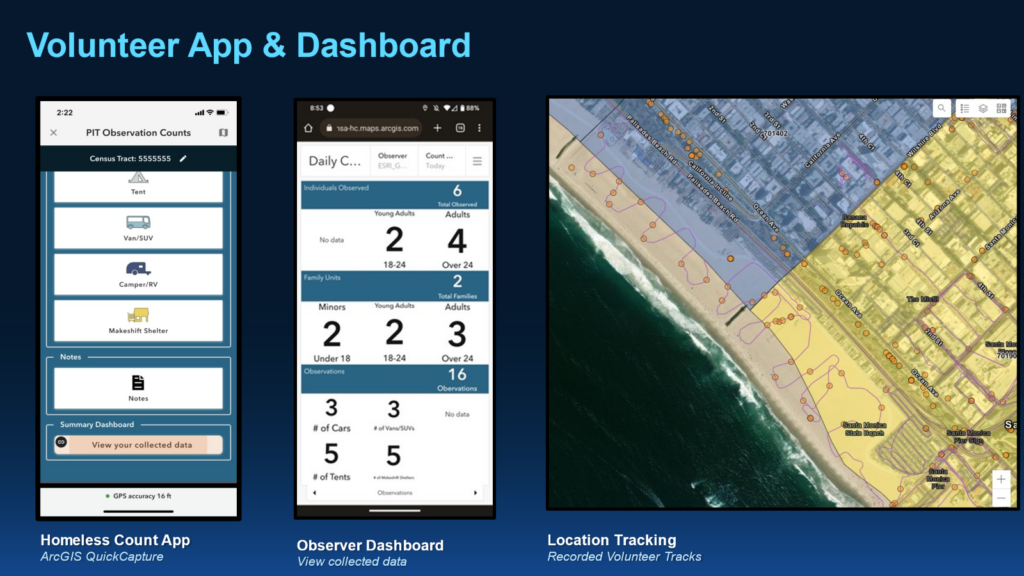
- ArcGIS Quick Capture: Used for the 2024 Greater Los Angeles Homeless Count, volunteers were able to easily and rapidly collect counts of individuals and/or dwellings such as tents and makeshift shelters with just a tap of a large button, Additionally, volunteers could review and validate the captured data before it was submitted, ensuring accuracy and consistency.
Demographic Interviews: This methodology involves face-to-face interviews with individuals experiencing homelessness to gather more detailed information about their circumstances.
- ArcGIS Survey123: Allowed for the customized design of the survey tailored to the organizations specific data collection needs adhering to HUD requirements for demographic PIT counts.
4. Location Intelligence Improves Data Accuracy & Quality Assurance
HUD encourages the use of technology to ease the survey administration burden of the PIT count as data electronically captured in real-time improves the quality of the data due to a decrease in entry errors common with paper-based PIT counts. By leveraging location sharing of volunteers, the lead organization can confidently validate that that area has been covered by a volunteer, providing quality assurance.
5. Organizations go above and beyond HUD requirements.
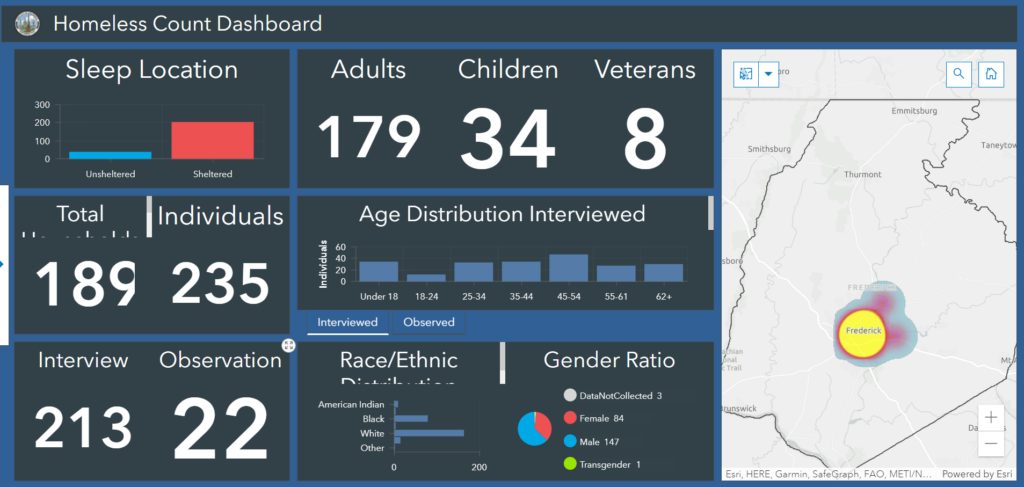
By leveraging GIS technology, organizations can go beyond the basic requirements of PIT Counts and gain a deeper understanding of homelessness in their communities. This understanding can inform evidence-based decision-making, facilitate collaboration among stakeholders, and ultimately contribute to more effective housing solutions and support for the homeless population.
Transparency: By utilizing GIS technology, organizations can enhance transparency in their Point in Time Counts. They can provide access to the collected data, methodologies, and results to the public, stakeholders, and policymakers. This transparency helps build trust, encourages collaboration, and fosters a better understanding of the homeless population and the challenges they face.
Community Demographic Insight: GIS enables organizations to analyze and visualize the collected data in a spatial context. By examining demographic patterns and characteristics of the homeless population, organizations can gain deeper insights into the specific needs and challenges of different communities. This insight can inform targeted interventions and resource allocation to address homelessness effectively.
Identifying Trends: GIS technology allows organizations to identify trends and patterns in the data collected during Point in Time Counts. By analyzing the data over time, organizations can identify changes in the homeless population, such as shifts in demographics, geographic distribution, or specific subpopulations. This information helps organizations adapt their strategies, allocate resources efficiently, and measure the impact of their interventions.
Housing Solutions: GIS can play a crucial role in identifying potential housing solutions for homeless individuals and families. By mapping available resources, such as affordable housing options, shelters, and support services, organizations can identify gaps and opportunities for improving access to housing. GIS can also help assess the suitability of different locations for housing initiatives, taking into account factors such as proximity to services, transportation, and employment opportunities.


