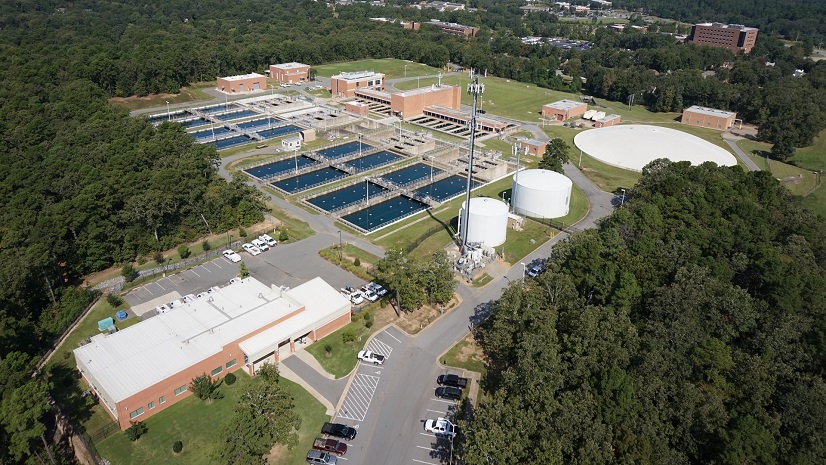
Hampton Shaler Water Authority (HSWA) is a medium-sized water authority located in western Pennsylvania serving the Townships of Hampton, Shaler, Boroughs of Etna, Sharpsburg, and portions of the Townships of O’Hara, Indiana, Richland, West Deer, Ross, McCandless and the Borough of Millvale. HSWA’s water source is 12 groundwater wells. HSWA has approximately 26,000 water customers and it distributes between five and six million gallons of water per day. The water is metered for residential, commercial, industrial, and institutional uses, as well as bulk sales to commercial/municipal customers. It is unmetered for internal uses, including flushing and testing purposes.
Accounting for Non-Revenue Water
HSWA knew over 35 percent of the water sent out into the system was unaccounted for. This non-revenue water includes anything that isn’t billed to the customer (e.g., billing errors or stopped meters), doesn’t make it to the customer (e.g., leaks), or is used to ensure the quality of the water (e.g., flushing operations), as well as the occasional firefighting/training uses. HSWA needed a way to find where their water was missing or unaccounted for so they could improve the services they were providing and save money. Accounting for non-revenue water would also help HSWA improve datasets needed for better-informed management decisions (e.g., line replacements/leak detection efforts) and for annual reporting to state agencies.
With recent investments in GIS, HSWA has been able to capture flushing data (both automated and manual) and leak information in real time. The next step was using the GIS system to help find where the unaccounted-for water was going by utilizing existing regional master meter data and individual account meter reads in the corresponding region. This would help to identify leaks, address billing issues, and reduce water losses.

Partnering for Success
Esri partner geographIT, a division of EBA Engineering, Inc. (EBA), is headquartered in Laurel, Maryland. The firm has 15 GIS staff members who provide comprehensive GIS and application development services. These services include cloud and on-premises enterprise GIS deployments, water/wastewater data and processes, ArcGIS Utility Network implementation, system integrations, tool migrations from ArcMap to ArcGIS Pro, emergency management support services, Next-Generation 911 support, and local municipality support. The team includes EBA’s project manager Joe DeLuca, GISP; HSWA’s executive director April Winklmann; and HSWA’s distribution manager Jacob Casile.
Esri Apps Turn Data into Understanding
The team set up tables in the HSWA water geodatabase to record regional/zone master meter readings and customer meter readings captured in HSWA’s billing database. They also configured an on-demand ModelBuilder process to auto-import the hydrant and flushing data into the GIS database. EBA worked with HSWA to identify regional locations in their service area that had meters on all incoming water sources. Filters were created on the data to track both the date and location of the activity/reading. Meter readings for both billing and the associated regional master meter data are captured per monthly meter reading cycle, as are the leak and flushing data. An ArcGIS Arcade expression was used along with ModelBuilder to calculate water usage from automated flushers by both day and month. This information was combined in an ArcGIS dashboard that includes filters for both the date and regional areas being tracked. There are currently five regional areas that are being tracked and have been added to the dashboard. As seen in the image, the dashboard displays the count of noises heard; the number of leaks repaired by month and year; the top 10 customers (calculated by usage) by billing cycle and year; flushing data by month/billing cycle, year, and all data captured to date broken out by flushing type; a chart showing non-revenue water by month; and a calculation of total regional metered water, water consumed by customers, unaccounted water loss, and accounted for flushing water usage by month, year, and all time. Another ArcGIS Arcade expression was used along with ModelBuilder to calculate the non-revenue water loss stats, including total water in and out to customers, unaccounted-for water, and combined non-revenue water usage. Future plans include adding firefighting/training water usage and expanding to other service areas.

Saving Water
HSWA was losing more than nine million gallons of water per month in the Etna area before they began non-revenue water loss data tracking. Over the past nine months, eight leaks have been found in this area, and the repaired leaks resulted in six million fewer gallons of water lost every month. The authority also conducted a detailed search for leaks in the Sharpsburg area, which was losing five million gallons of water each month. Thanks in part to the information shown in the dashboard, a leak was found and repaired, which stopped almost all the non-revenue water loss in that area. The Sharpsburg leak was buried nine feet underground, beneath an abandoned railroad. The leak was in an area with sand and gravel alluvial materials, meaning there were no apparent signs of a leak above ground. The leak likely would not have been found if the losses weren’t identified in this area.
This data has proven to be in sync with what crews are finding on the ground. Water usage trends going up are often quickly followed by field crews hearing noises in the associated area while checking for leaks. As leaks are repaired, water usage trends drop, identifying the approximate amount of water that was being lost through the repaired leak(s). When shared with the management team, this data helps to plan both short-term leak detection/repair work and long-term line replacement priorities. Overall, this GIS-aided process helps to streamline and solidify decision-making. HSWA, using this new data system, has saved millions of gallons of the precious resource of water.
“Having these processes in place helps us to identify leaks that have been an issue for months or years. Thanks to this success, we are looking to invest in additional regional meters and expand the program throughout our service area as appropriate.” – Jake Casile, HSWA Distribution Manager
Stay Connected with Esri’s Water Team
ArcGIS is an extensive information system that enables modernization of workflows with easy-to-use applications for the field and office. Strengthen your organization with smart water solutions that will increase efficiency and provide insight for decision-makers. Visit the Esri Water Utilities web site for more information.
Join the Water Utilities Community
Follow #EsriWater on social media: X | LinkedIn
Subscribe to the Water Industry newsletter “Esri News for Water Utilities and Water Resources“


