This year’s UC theme was Creating a Sustainable Future with GIS. Following are conference highlights for nonprofits, NGOs, and global organizations focused on creating a more just, sustainable future
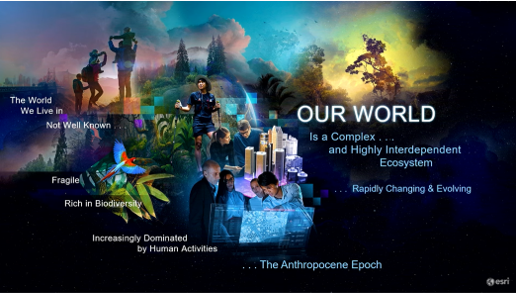
This year’s Esri User Conference (UC) was all about creating a sustainable future, and the critical role that GIS plays. Our world is a highly complex and interdependent ecosystem that’s rapidly changing and evolving. We’re in what geologists are calling the Anthropocene epoch, where our world is increasingly dominated by human activities. And our world is being challenged in many ways – from climate change, pollution, and the decline in biodiversity, to racial injustice, unconstrained development, and social conflict.
Social, economic, and environmental: Seeing and understanding the connections
Creating a sustainable future will require us to dramatically change our priorities, develop a deeper understanding of our world, and also see the world as one single ecosystem with all of its interconnections. Geography provides the science and the language to do this. A geographic approach organizes and integrates all the factors about our social, economic, and environmental systems in a holistic way that illuminates patterns and relationships. It’s a way of thinking and problem solving, and provides an integrative framework for understanding and managing our planet. Hear more from Esri President Jack Dangermond in the UC plenary about how the geographic approach and GIS are applied to create a more sustainable future.

Hear from keynote speakers in the UC plenary about creating a sustainable, just, and inclusive future for people, ecosystems, oceans, and forests:
- La June Montgomery Tabron, President of W.K. Kellogg Foundation: Expanding Racial Equity through Community Action and the SDG Data Alliance
- Paul Salopek, Out of Eden Walk: A Walk Through the Anthropocene
- California Secretary for Natural Resources Wade Crowfoot: Nature-Based Solutions in California: Combating Climate Change and Achieving 30×30
- Dr. Enric Sala: 2021-2030: Our Last Best Chance to Protect the Ocean for the Benefit of Humanity
- USDA Forest Service Chief Vicki Christiansen: Stewarding America’s Forests with a View from the Cloud and Boots on the Ground
The Sustainable Development Goals and Reducing Inequality
There must be progress on SDG 10 for all other SDGs to succeed.
The 2030 Agenda for Sustainable Development was adopted by all United Nations Member States in 2015. It provides a shared blueprint for peace and prosperity for people and the planet, now and into the future. The 17 SDGs are an urgent call for action by all countries – developed and developing – in a global partnership. The UC Special Interest Group, “Addressing SDG 10: Reduced Inequalities,” focused on the integral nature of SDG 10, and the recognition that reducing inequalities of all kinds is fundamental to achieving all SDGs, and creating a just, healthy, and prosperous world where no one is left behind and everyone can thrive.
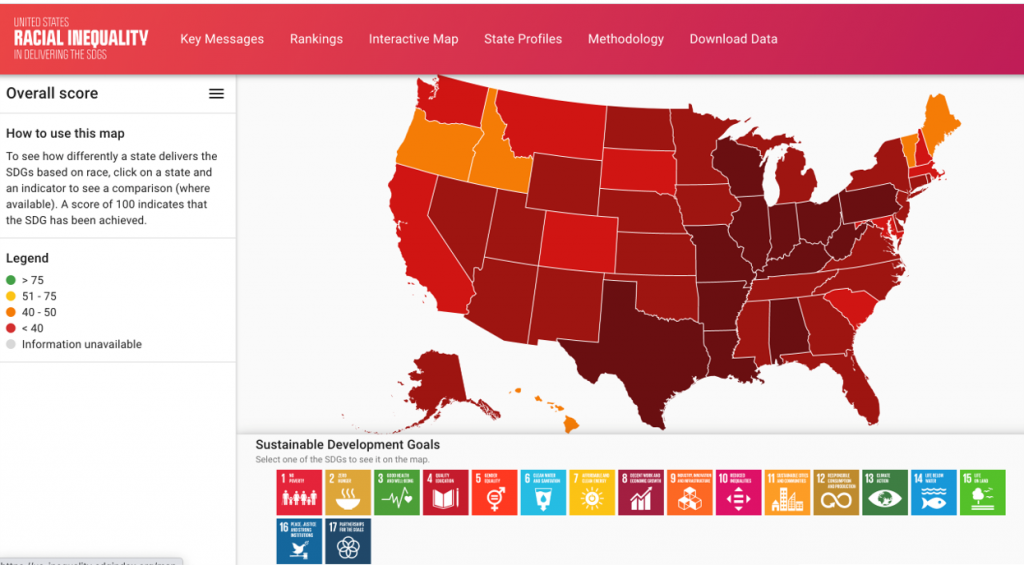
Maryam Rabiee from Sustainable Development Solutions Network joined the session and presented interactive maps that demonstrate how the US has failed to deliver on the promise of racial equality. She shared the SDGs Today, the global hub for real-time SDG data. Additionally, Rabiee provided a walk-through of the My School Today! initiative, which aims to support students and local communities to geo-reference their schools and education facilities as part of an effort to promote timely information on school locations in Africa.
Greg Scott (Global Geospatial Information Management, Environmental Statistics and Geospatial Information Branch, United Nations Statistics Division) also joined the session, and shared the IGIF (Integrated Geospatial Information Framework), as a multidimensional framework that is aimed at strengthening national geospatial information management in countries, and in developing countries in particular. Scott also presented the SDG Data Alliance. Driven by an overwhelming realization of the urgent need for data, the United Nations, W.K. Kellogg Foundation, PVBLIC Foundation, Esri and others are working together on the SDG Data Alliance. The vision of the partnership is to enable government and civil society stakeholders at national and local levels to monitor SDG progress more effectively by using leading geospatial technology and contributing to open data systems. It provides a tangible “recipe” for countries to bridge the digital divide, make data visible, and translate global challenges into local actions across the 17 SDGs – including SDG 10.
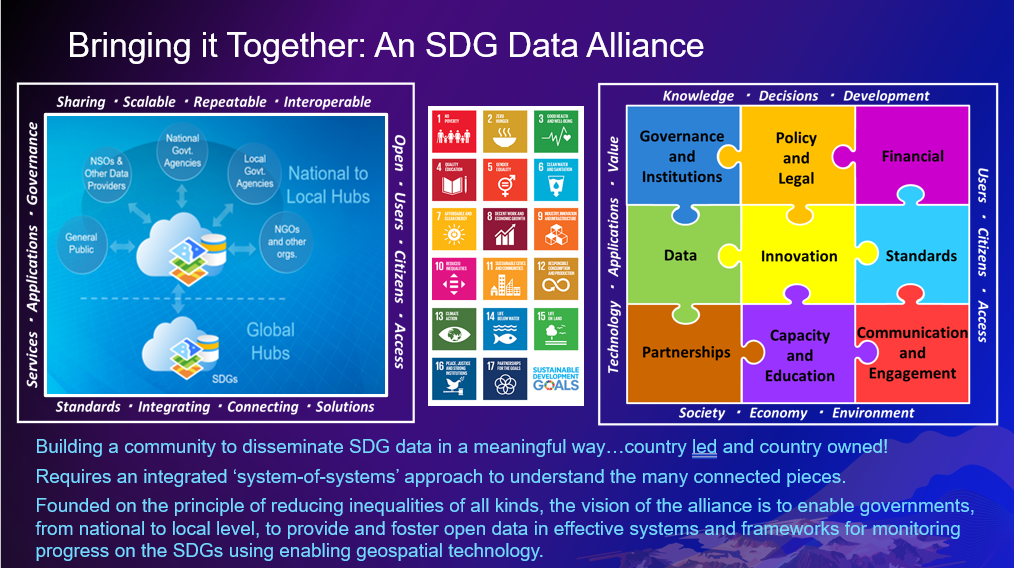
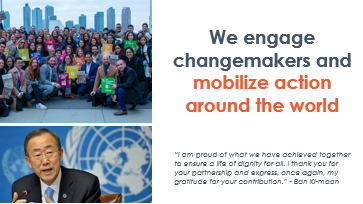
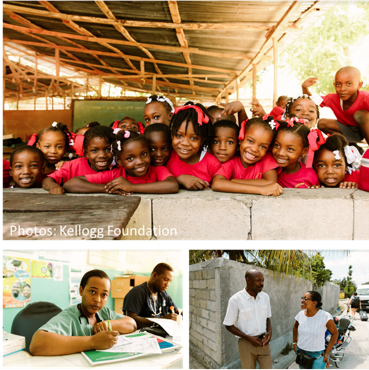
Stephen Keppel, president of PVBLIC Foundation, rounded out the session. PVBLIC Foundation advances and accelerates change and mobilizes action around the world through innovative programs and partnerships. Keppel expanded on the SDG Data Alliance, which is based on the foundational principle of reducing inequalities of all kinds, and will accelerate achievement of the SDGs by creating SDG data hubs across developing nations. Additionally, Keppel provided a walk-through of the Haiti SDG Data Hub, which aims to utilize nationally integrated geospatial frameworks and support Haitian institutions to better coordinate and realize their data needs for achieving the SDGs.
Community Engagement for Nonprofits and NGOs
Community engagement is critical for nonprofits, NGOs, and other mission-driven organizations that rely on volunteers and citizens to move their mission forward. In a special interest group session, we heard from Feeding America Riverside | San Bernardino (FARSB), Democracy Labs, and Field Museum.
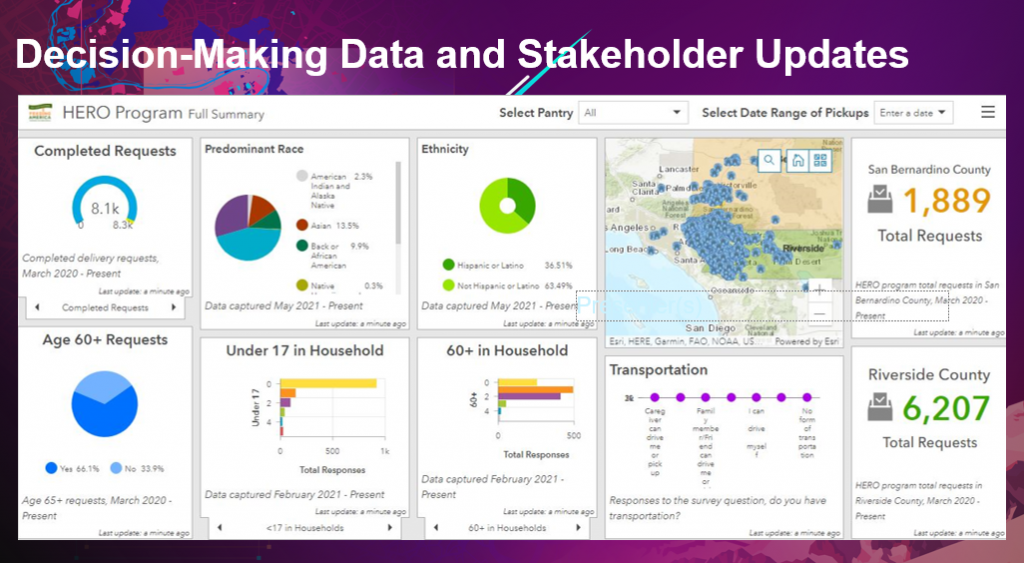
FARSB CEO/CFO Stephanie Otero presented the HERO program (Homebound Emergency Relief Outreach), which engages volunteers to deliver meals. The HERO program began as an effort to assist seniors and homebound residents in need of food during the early stages of the COVID-19 pandemic. Since then, FARSB has continued to help deliver fresh and non-perishable food to thousands of people in the Inland Empire in California. The HERO program leverages ArcGIS for volunteer allocation, service area mapping, hunger hotspot identification, storytelling, and real-time data tracking. “It’s helping us identify where the really high-need populations are,” said Otero. HERO uses maps and location intelligence to streamline the food delivery process. Volunteers and those requesting assistance now fill out forms online that feed into the Volunteer Delivery Dashboard. This web-based dashboard lets volunteers easily see if there is a home delivery near their location and assign themselves to make the delivery.
Deepak Puri, co-founder and CEO of Democracy Labs, presented how technology can be used to engage communities. Nonprofits often have to deal with tight deadlines, strict budgets, and small staffs. Technology can be an equalizer in helping nonprofits get their message out. Democracy Labs works with nonprofits on a pro bono basis to identify their technology needs and accelerate deployments. Examples of matching ArcGIS to a nonprofit’s need to engage communities include:
- Question: How do I let others know what my nonprofit is doing?
- Answer: Storytelling with ArcGIS StoryMaps makes data understandable. Example StoryMap – Cash Cows Block Rural Internet.
- Question: How do I make a compelling case to encourage people to do something about it?
- Answer: Data mapping with ArcGIS Online shows communities how an issue impacts them personally based on where they live. Example interactive map – Fatal Encounters.
- Question: How can we respond quickly to fast moving events?
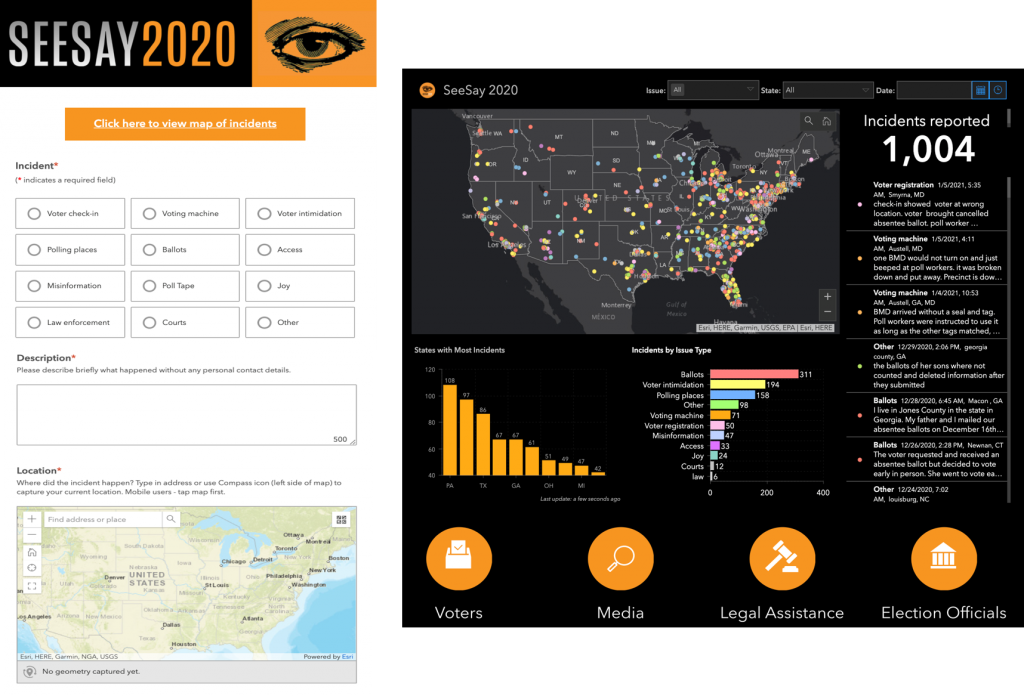
- Answer: Crowdsourcing with ArcGIS Survey123 and ArcGIS Dashboards to collect, analyze, and share data. Example crowdsourced map – SeeSay 2020.
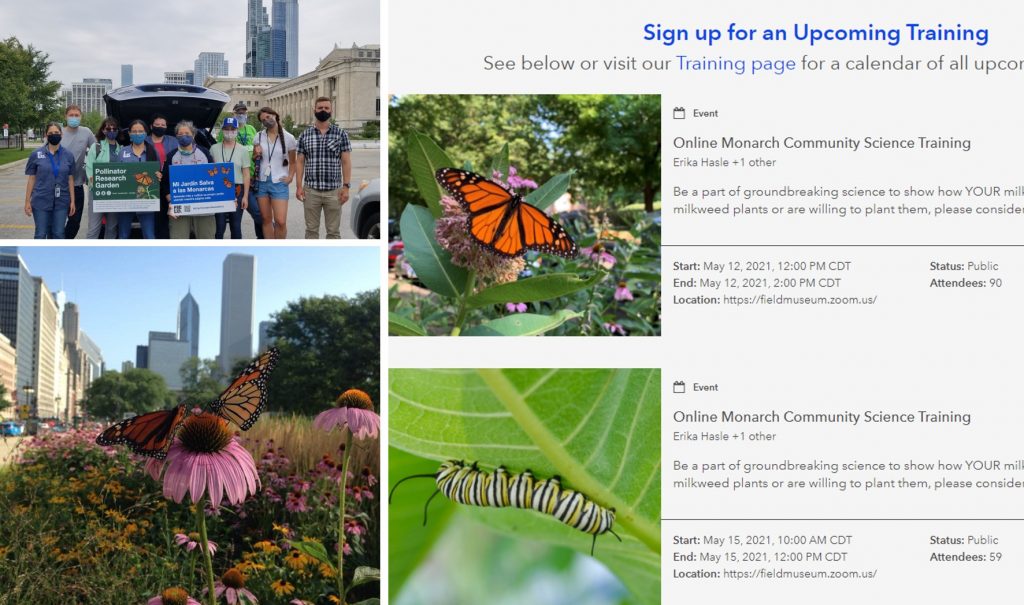
Karen Klinger of the Field Museum closed out the Community Engagement for Nonprofits and NGOs session with an overview of using ArcGIS Hub and ArcGIS Survey123 for their Monarch Community Science initiative. The eastern monarch butterfly population has declined over 80% in the last two decades. Scientists at the Field’s Keller Science Action Center are working to understand the role urban places play in supporting monarch butterflies, to implement community science programs around Chicago, and to develop resources that anyone can use to help monarchs and other pollinators. Introducing milkweed – the only plant monarch caterpillars can eat – in home gardens and in natural areas around schools, offices, parks, and roads, can support the monarchs. Community scientists receive training for monitoring and reporting on milkweed gardens. The data collected by community scientists helps researchers at the Field Museum understand how successful milkweed plants in cities and towns are at providing habitat for monarch caterpillars.
Resources for Nonprofits and NGOs
- Esri Nonprofit Program – Access data, technology, and resources to advance your mission
- @Esri_Nonprofit – Follow us on Twitter
- Esri Nonprofit & NGO e-Brief – Subscribe to get news and community stories
- Sustainable Development Goals – Read about GIS and the SDGs
