The first time I ever attended the annual Esri User Conference in San Diego my dad bribed my sisters and I with the promise of food. As a GIS professional he had a map displayed in the events map gallery and asked my sisters and I to visit after spending the day at the beach. The first time I attended the UC for work I was a college student at Wellesley, in an internship and took advantage of our great complimentary passes. For the past ten years I have been attending the UC on behalf of local government internships, nonprofits, and private companies I’ve worked for. July 2023 was my first UC wearing the Esri employee red badge. It has been fun to look back on all the changes that have happened since 2013. The Young Professional Network has a huge presence allowing for students and young professionals to network with one another and learn about GIS careers, Equity and Social Justice has a larger presence with dedicated user presentations and a prominent spot on the expo floor. It is also nice to know that the UC continues to be a time where people flock to San Diego every July to connect with friends, colleagues and mentors.
During this year’s plenary Esri founder, Jack Dangermond, addressed this year’s theme, “Creating the World You Want to See” and asked the audience “What kind of world do you want to see?” He said that the world is changing, evolving and we have a choice to take collective responsibility and imagine and create a future we want to see.
Creating the world you want to see, has been a personal motto of mine since I began my professional career at the intersection of equity and GIS. I began my GIS career with the desire to create and work with maps that enhanced people’s lives and illuminated inequities so community members could be empowered to continue to advocate for themselves. GIS is a tool for empowerment, and I will continue to uplift stories of people doing impactful work with GIS. It was nice to see equity and social justice as a focal point at this year’s UC, so I also decided to highlight this work below.
Equity, Front and Center on the Main Stage
Jack mentioned Social Equity in the opening plenary and spoke about the work being done in the City of Tacoma, the City of Los Angeles, and across many other communities.
Also on the main stage, Jess Altamira and Chris Messerich demonstrated how the urban heat island effect in Richmond, Virginia corelates with historic redlining maps. They also demonstrated the new socio-economic status index from the living atlas. All these new features allow for jurisdictions to view tree canopy data, transportation routes, updated data layers and visualize additional causal effects of heat islands in the city.
“New capabilities empower you to do the work that matters to you.” -Chris Messerich. Watch the video here.
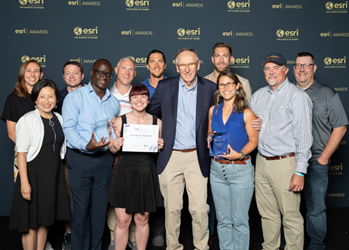
In addition to the highlight during the plenary, equity work was also celebrated during the “Making a Difference Award” ceremony. The award honors organizations or individuals who, through their use of GIS, have made a positive impact in their community. Selected by Jack Dangermond and Esri leadership, the Making a Difference Award recognizes the use of GIS to contribute to a better world.
The Netherlands was recognized this year, for their work in creating nationwide tactile maps for the visually impaired.
Another highlight during the award ceremony was Dr. Paulette Brown-Hinds Founder of Voice Media Ventures & Mapping Black California (Black Voice News). Dr. Brown-Hinds runs the largest black newspaper in California and is crusading the work of equity across cities and counties in the state. Their work not only maps the negatives but resources in the community as well. Her organization also has a leadership academy that teaches GIS to Black girls, they have introduced GIS technology to about 500 Black girls and are beginning to graduate students from the academy.
Learn more about Dr. Paulette Brown-Hind’s work here.
City of Tacoma receives SAG award for Equity Index
In 2018, the City of Tacoma introduced the Equity Index, an interactive tool that visually highlights access to opportunity by mapping disparities across the city. It uses 32 data points sorted into five categories to determine where community members are not able to access services or where services do not meet community needs. It is one of the primary tools that city staff, partners, and other decision makers use to help ensure they are making data-informed decisions to improve access to opportunity for all community members.
Access their SAG award details here: Special Achievement in GIS Award.
For the second time at an in person Esri UC we had a dedicated session track for Equity and Social Justice presentations. Since there were so many great presentations to highlight this year, I wanted to share the users work below:
- Check out this technical workshop that examines healthcare access to understand how new state policies will impact access to healthcare for women and people with uteruses across the country: 2023 Esri UC – Detailed Agenda
- Communicating Data Effectively to Stakeholders to Achieve Park Equity
- Configuring Hub to Promote Equity
- Highlighting Transportation Inequities
- How GIS Is Used to Address the Digital Divide
- Louisville Metro Government has been working hard to eliminate the digital divide that exists in our city. This presentation discussed how we use GIS tools to expand fiber infrastructure, build and enable free Public Wi-Fi networks, and plan focused efforts of Internet adoptions with the Affordable Connectivity Program.
- Research on digital divide has shifted towards exploring patterns of Internet usage. This project analyzed digital divide at its second level- Internet usage. Relationships between demographic and socioeconomic factors on purposeful Internet use were analyzed through spatial autocorrelation and ordinary least squares regression analysis.
- How Organizations are Applying GIS to Racial Equity
- How to Engage Community Stakeholders through the Use of GIS
- The Māori Engagement Platform was initiated in response to Auckland Council finding low levels of satisfaction in the way that Māori were being engaged. Council’s existing processes were inefficient, siloed and didn’t foster the development of Māori capacity to contribute to council’s decision-making processes. The spatial platform draws information from Council’s existing systems allowing Māori and Council to share information efficiently.
- Illuminating the Relationship between Geography and Racism
- Using an Equity Lens to Make Data Informed Decisions
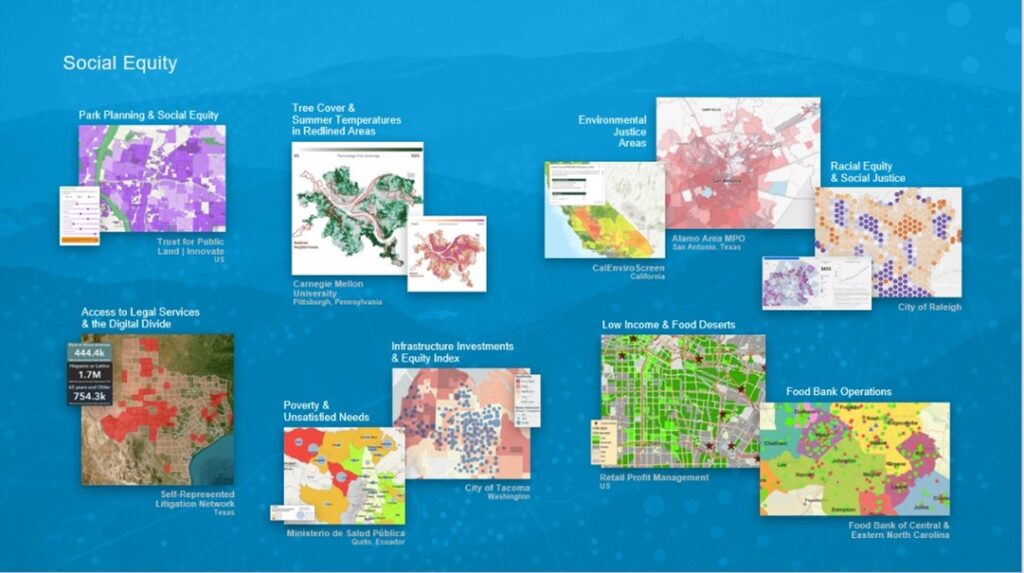
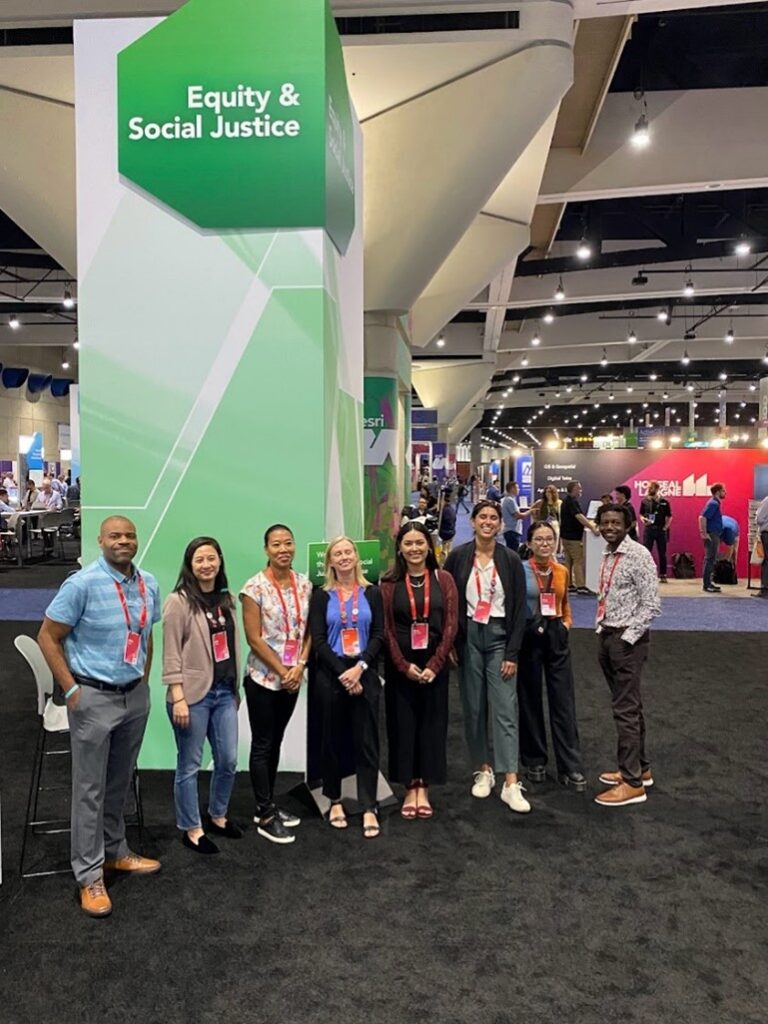
Equity and Social Justice on the Expo Floor
For the second year in a row equity and social justice was represented on the expo floor alongside other Esri initiatives. Esri staff were onsite to assist users who stopped by the booth with questions or comments. Conversations were insightful as they provided the Esri team further understanding of the work you are doing.
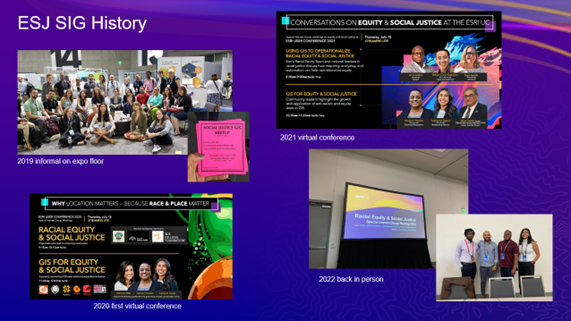
Equity and Social Justice Special Interest Group
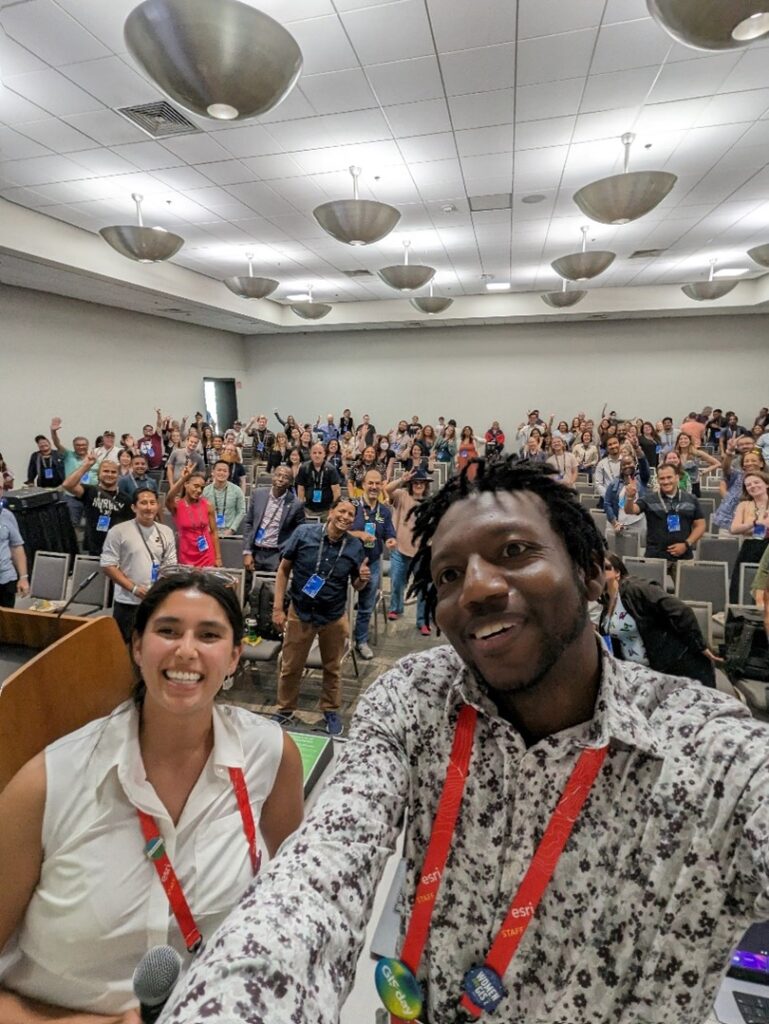
In 2019 in the Sustainable World area of the expo the first Equity and Social Justice SIG occurred. It was customer lead and not officially on the agenda. The co-moderators Victoria Beckley and myself went around the conference handing out bright pink flyers inviting participants to attend our informal SIG. 30 people showed up and the SIG was born. Four years later the SIG continues to be a space for users to meet and network with one another. Alongside, Clinton Johnson, Racial Equity and Social Justice Lead, we co-moderated the session and asked participants to form small groups and get to know their fellow equity and social justice GIS professionals. The room was jam packed and attendees left invigorated and excited to continue collaborating with one another.
As I reflect on the whirlwind week of mapping, equity, and networking the following themes arose:
- Equity is top of mind for GIS professionals across numerous industries. From the numerous presentations in education, environmental sessions, the plenary stage, conversations held at our booth and across industry SIGs.
- Esri customers, ie you, are interested in learning how to get started in equity and GIS work. Most of the folks who came to the equity and social justice booth were state and local government professionals looking for ways to incorporate equity into their work due to a local equity office or initiative. We are also encountering an influx of nonprofit users who have been paving the way for equity for decades and are now integrating GIS into their work.
- We also saw several customers who want to elevate their equity and GIS work. There is a lot of interest in creating indices, using the social equity analysis tool and configuring HUB sites to share their work out with their community.
- Civic Nonprofits are attending the Esri UC in greater numbers. From the NAACP, Dolores Huerta Foundation and Unidos to many others.
- The 2023 Esri conference theme, “create the world you want to see” resonated with equity and social justice customers from around the world because it is the mission they have been guided by from the beginning.
Thank you all for a great conference and hope to see you again next year! To stay up to date on equity related case studies, events, and webinars please join our LinkedIn group! Esri Equity and Social Justice Group