About one hour northeast of San Antonio, Texas, the small city of Seguin serves just over 30,000 residents with water, wastewater, and electric utilities.
Within the Utilities Department, smart grid solutions manager John Saldana creates systems that tie together the water utility and electric utility departments.
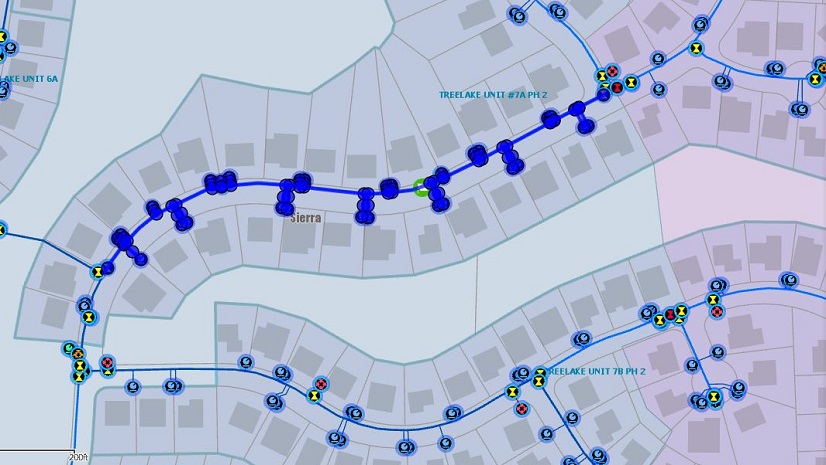
“If anyone needs a map for internal, nonpublic information—whether it’s electric, water, or sewer—in order to support utility infrastructure projects, that comes from us,” Saldana said. “We are the middleman between utilities and the city, so we support all of their technology needs, beyond the traditional IT department.”
Increased Development Drives the Need for Accurate Utility Maps
The City of Seguin is experiencing solid growth as it expands toward neighboring New Braunfels, and vice versa. As farmland between the cities is developed, the demand for municipal water, sewer, and electric services is rising.
The city wanted to find a way to accurately map existing assets prior to development as well as new construction as utilities are installed. In this way, they help builders avoid hitting existing utility infrastructure during construction and set themselves up for success in the future, when crews will inevitably be sent to service the utility grid.
“The assets are all very close in proximity to each other, so it’s important that we have the best accuracy we can. We’re trying to prevent accidents with water and electricity.” – John Saldana, smart grid solutions manager

The Solution: ArcGIS Field Maps, Arrow Gold GNSS Receivers, iPad Devices
Saldana equipped field crews with ArcGIS Field Maps, which allowed him to control incoming data quality.
“Data does not exist in a silo,” Saldana said. “It’s designed to be shared, expanded upon, integrated, and consumed upstream and downstream. We keep this in mind as we’re building and capturing something as simple as a point. This is where it all starts. That information keeps flowing through the systems to build upon these projects and information to whoever would like to use it.”
To ensure location data comes in with high accuracy, Saldana deployed four Arrow Gold global navigation satellite system (GNSS) receivers from Esri partner Eos Positioning Systems. The Arrow Gold receiver connects to an Arrow Gold base station, which provides real-time kinematic (RTK) corrections that allow field crews to stream survey-grade locations into ArcGIS Field Maps on iPad devices.
Saldana tried many GNSS receivers before choosing the Arrow Gold, but each came with its own limitations: expensive subscriptions, complex training, inability to achieve the advertised level of accuracy, poor customer service, and, in one case, a receiver that could no longer support the evolution of Esri apps.
“All told, we had gone through several other manufacturers and their products, and they were just not what we were looking for,” Saldana said. “With our small team, we have limited resources, limited budgets, and diverse projects. So we’re always looking for technology that is very simple but also complex enough to handle a variety of situations.”
The city also chose to install its own Arrow Gold base station to control its RTK corrections, after testing various private base stations in the area.
“We would pay a fee to use them, but they were down too often,” Saldana said. “They just weren’t giving us the right amount of reception and satellites needed, and we noticed a lot of base stations, especially those in rural areas, were not maintained too well.”
The Workflow: Capturing Existing Assets and New Developments
Today, the City of Seguin has one full-time data collection employee who captures high-accuracy data all day long. All other field staff have been trained to use field data collection tools set up with ArcGIS Field Maps and the Arrow Golds.
To map existing utilities, Saldana waits to hear the key action items from the city’s predevelopment meetings. There, landowners, builders, and other stakeholders discuss what utilities are currently on the land, how best to tie them into the municipal system, and whether existing assets require upgrades to accommodate the amount of expected new residents or development. This information is passed back to the Utilities Department so Saldana can assess how quickly he needs to send someone to map existing utilities. He can pass that information on to third-party builders, then share it with the appropriate staff and outside parties.
Once on-site, the data collector interprets drawings and their knowledge of the area to determine where assets are located. Sometimes they use underground utility locators or, in the worst cases, dig up (or “pothole”) the ground to locate assets.
“Older infrastructure is harder to map,” Saldana said. “It takes experience plus treasure hunting. But once we capture a few, we can identify a pattern and usually sort some things out. Thankfully, some of our staff can point at a tree [using it as a marker] and tell you not only there’s an asset there, but also what direction it’s flowing. They’re our go-to people when we want to know what’s around. So now we’re capturing that in our system as fast as we can.”
As the data is captured, utility data analyst Felecia Helms performs quality control checks before publishing information to the enterprise GIS. Saldana hired Helms in 2023 as the city’s second utility data professional.
Then, as construction occurs, Saldana sends someone to map assets in real time. The quality of their own captured data is far better than interpreting paper as-builts from third parties, according to Saldana.

“I can tell you that on new developments, when we receive a big roll of paper drawings, those are not 100 percent accurate,” Saldana said. “By going out there and validating it ourselves, we can be sure that years later, when we receive a call to go out there, we’ll be glad that we put our own eyes on it and captured that information firsthand. Now we know for sure where our assets are.”
By building out the city’s utility maps with such high accuracy, Saldana and Helms have been able to better prepare for two big projects. There is one each for the water utility and electric utility departments, with Saldana leading the electrical project and providing assistance as necessary to the water project.
AMI Meter Replacements Help LCRR Compliance Efforts
According to Saldana, the city has always had an inventory of its water taps and mains but, like most cities, didn’t collect customer service line inventories. This creates a challenge in complying with Lead and Copper Rule Revisions (LCRR) requirements. The updated rule, Lead and Copper Rule Improvements, includes new regulations that require utilities to determine whether any service line material is lead—including any lead line running past the meter—so it can be replaced.
“Generally speaking, anything after the meter is customer infrastructure and not tracked or maintained by the city,” he said. “So I can see how many utilities might struggle to identify the service line type.”
However, also like many cities, Seguin is currently deploying an upgrade to advanced metering infrastructure (AMI) and water meter transmission units (MTUs, which are battery-powered devices attached to water meters that transmit consumption data for billing). The two projects dovetailed.
As technicians install smart meters, they take before-and-after photos of the meter and map its location. The data is captured in ArcGIS Field Maps with centimeter-grade accuracy, and Saldana expects the photos and locations to help the city comply with federal lead service line regulations.
“We were able to leverage the replacement and upgrade to gather pictures of the meter pit and service lines, as long as it was feasible without slowing down the meter change-out, which was our priority,” Saldana said. “Sometimes the meter pits are a mess with dirt, mud, bees, and other critters. It can be difficult to always see the service line. However, it gives us a great start to identify the type of materials being used in different areas of the city.”
Along with scouring historical data from service orders and work orders, Saldana says the city is conducting a feasibility study to prototype an artificial intelligence (AI) model that could potentially use photos taken during the meter upgrades to identify material types. Saldana is using TensorFlow Lite Model Maker, a Python library, and an open-source image-labeling tool called Label Studio. Together, these tools allow Saldana’s prototype to train a custom model of meter pit images. The hope is to be able to input service-line photos into this model, have the AI identify which residential service areas have lead service lines, target those for replacement, and finally validate the changes for compliance.

“I first heard of a few utilities trying to use machine learning and AI to predict areas that might contain lead,” Saldana said. “But the Lead and Copper Rule requires documentation review from code ordinances, service records, and similar records. So I will continue to work on my prototype, but we, like every other utility, will still have to do the hard work and follow the rules and guides set by the rule with regards to documentation review. In addition to streamlining compliance, the GIS is also enabling a smoother transition to ArcGIS Utility Network. “
Migrating Electric Records to ArcGIS Utility Network
Another big project Seguin is undertaking is the city’s migration of electric utility data to ArcGIS Utility Network, a tool for better managing utility systems. Helms is heading up this migration.
“Many people have no idea how much work goes into migrating to ArcGIS Utility Network,” Saldana said. “Right now, she’s tackling the Utility Network migration, which is a big task.”
Initially, Saldana built the city’s ArcGIS Utility Network prototypes, and now Helms is bringing them into production. The city also hired a third-party company to collect field data and update some of the details and data; they will then put this data into the prototypes before Helms completes the migration. The Utilities Department has partnered with an outside contractor to assist with a comprehensive study and collection of electric assets, including transformers and poles, to ensure the data is of production-level quality. Helms has been monitoring the incoming data to ensure it meets the city’s quality standards.
“With the help of John [Saldana], we already built a utility network that is mostly functional,” Helms said. “It was all connected, except for one dirty area that couldn’t seem to be fixed. So now we’re just trying to get all the assets triple-checked and ensure the data is correct. Then we can do a full connection for our utility network to move to the next phase.”
Once the migration is complete, ArcGIS Utility Network will be used to manage the entire electric system and feed the outage management system (OMS) with valuable data for proper intervention. Once the electric migration is successful, Helms will tackle the water utility network.
Looking Ahead
Since the start of the project, Saldana has assisted with hiring a new GIS Manager, Travis Acklin, due to the recent growth in Seguin. Acklin has been tasked with taking over the GIS for Lead and Copper Rule compliance efforts. Like Saldana and Helms, Acklin will focus on initiatives that grow and strengthen their GIS to better serve the needs of the water system.
At the end of the day, Saldana says, the city’s success lies in having accurate GIS data. The enterprise GIS acts as the system of record for the AMI, supervisory control and data acquisition (SCADA), billing, and OMS systems.
“I’m passionate about traversing all these data integrations and making sure it’s accurate,” Saldana said. “People have to recognize that good asset management starts with collecting good data.”
Stay Connected with Esri’s Water Team
ArcGIS is an extensive information system that enables modernization of workflows with easy-to-use applications for the field and office. Strengthen your organization with smart water solutions that will increase efficiency and provide insight for decision-makers. Visit the Esri Water Utilities web site for more information.
Join the Water Utilities Community
Follow #EsriWater on social media: X | LinkedIn
Subscribe to the Water Industry newsletter “Esri News for Water Utilities and Water Resources“


