How Geography and ArcGIS Solutions Could Bring About Change
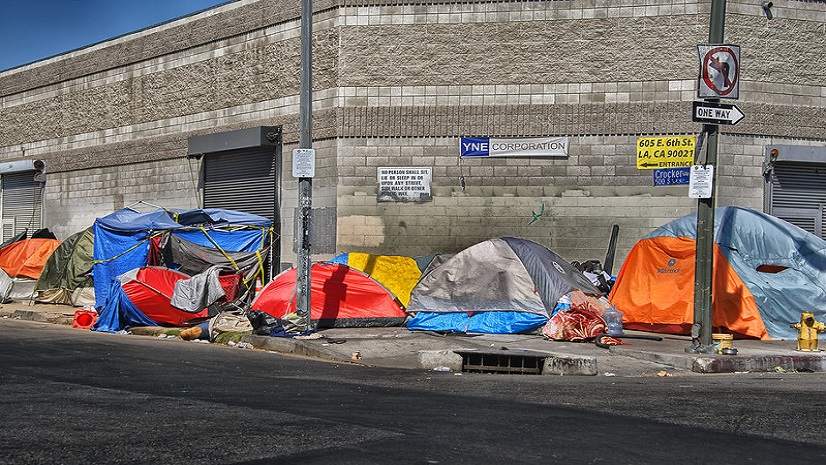
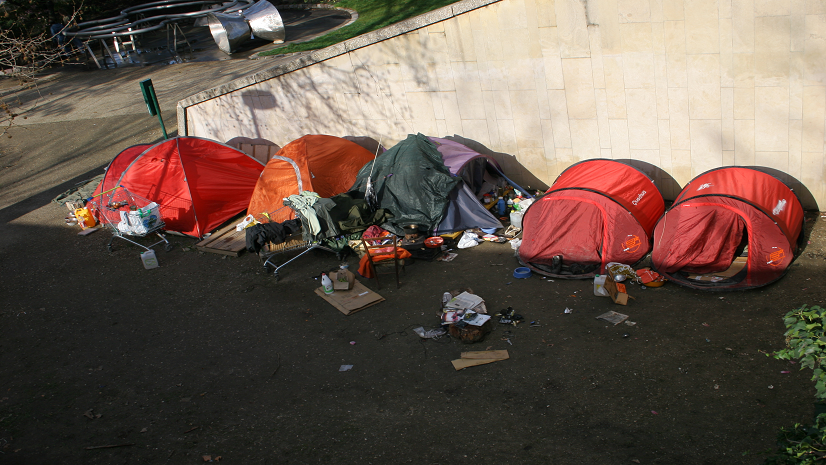
I turned the corner in my car and saw a homeless woman kneeling by the curb. She appeared to be in her mid-thirties, tattered clothes, her worldly possessions in a shopping cart nearby. She looked weary with an expression of desperation on her face. She dipped her hand into the water running alongside the curb she was genuflecting at, as if it was a small bowl of holy water. She raised her hand towards her face and made the sign of the cross.
In that solemn moment, perhaps she simply needed to say a prayer. I wondered to myself, what was she praying for, and would her plea be answered? Was she longing for shelter, food, companionship, or medicine? Or perhaps, just a prayer to live another day.
Sheer survival consumes the lives of individuals experiencing homelessness. Death rates are on the rise. Some reports estimated that 40,000 homeless men, woman and children died in 2023. Providing housing could prevent many of these deaths. But what can communities do to reduce the number of deaths as we work towards the goal of providing shelter? Something needs to be done.
What is Causing People Experiencing Homelessness to Die?
Understanding what causes death in homeless can lead to a better understanding of what we can do to help them survive. When you begin to uncover the causes of the casualties in the homeless population, you quickly realize it will take the coming together of many disciplines to bring the numbers down. Needed are solutions from health, human services, planning, emergency response, law enforcement, and public works.
Unfortunately, the leading cause of death in this community are drug overdoses. But the list of other causes is quite extensive. Suicide in young people is a major threat, as is, lack of adequate access to healthcare is another. Cardiac arrest is another.
Moving from health and social services interventions we find that traffic accidents are increasingly contributing to loss of life. Climate change is cause for weather-related deaths. The increasing hot and cold extremes will continue to be major contributors. Homeless populations are hit hard by the increasing number of natural disasters such as fires, floods, and hurricanes. Makeshift homes in areas prone to disaster provide limited time to get people to safety. It’s disheartening to know that increasing violence against the homeless community is a contributor as well.
The Geography Connection
Understanding where deaths are happening can provide insight into opportunities to intervene. For example, knowing where homeless deaths caused by traffic accidents can provide insight into road and pedestrian improvements. Protecting homeless populations from disease and virus outbreaks can take the form of sending teams to known locations of encampments to provide hepatitis A or COVID-19 vaccines. Knowing the location of automated external defibrillators (AEDS) could save lives.
Saving lives starts with an accurate homeless count. Local governments such as the Los Angeles Homeless Services Authority (LAHSA) have used the Esri Homeless Point in Time solution. This free solution is part of the ArcGIS Solutions for homelessness. This location-based solution set is used to conduct counts of sheltered and unsheltered individuals experiencing homelessness. The solution includes operational dashboards and volunteer management functionality.
These applications help set an accurate benchmark to know where your homelessness populations are located. If used every day after the count, local government staff, citizens, and volunteers can help keep track of changes in location. If inclement weather becomes a top priority, aide can be provided by connecting the right resources where they are needed.
The Answer to A Prayer May Need Different Thinking
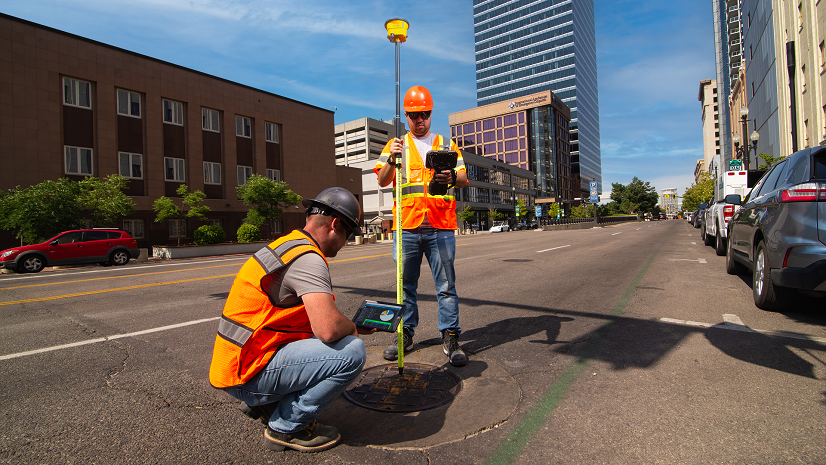
When you reexamine the different causes of death amongst the homeless populations you can see we need to bring together multiple perspectives to help solve this problem. Public works may be able to intercede through their Vision Zero efforts to reduce pedestrian injury and deaths. The ArcGIS Solution for Vision Zero can be used to identify transportation hazards and dangerous traffic behaviors on roadways from bikers, drivers, pedestrians, and others using public streets. The Community Health Outreach solution could be used to help connect much needed health resources.
Coming across the homeless woman in prayer caused me to pause and reexamine the ArcGIS Solutions Gallery for tools that could help a local government address the increasing death rates in the homeless community. My years of meeting with various government departments has taught me to explore how a tool built for one problem can be applied to another. Knowing what causes death in homelessness populations in my community took a little research. Here are the ArcGIS Solutions I think can play a role in answering the call to help this community, that I encourage you to explore:
- Homelessness Point-in-Time Counts
- Community Health Outreach
- AED Inventory
- Immunization Outreach
- Crime Problem Management
- Operations Management
- Vision Zero
- Flood Impact Analysis
- Opioid Epidemic Outreach
- Emergency Management Operations
Next Steps May Be Changing the Conversation
The next step after exploring the gallery is to start having conversations with your peers. Start shifting the question to do you know why people are dying at that location.
I tested this approach out myself the past couple of weeks. I was curious to know if some of the transportation professionals focused on reducing traffic injuries and fatalities if they had ever looked at the proximity to unsheltered populations to pedestrian deaths. Turns out many had not. They were focused on mitigating the traffic conditions. Turns out changing the focus of where to include another discipline’s view might just save a life.