Pop Quiz – How many zeros does a quadrillion have?
The answer is 15. According to the Energy Information Administration, the U.S. consumed about 100 quadrillion BTUs (British Thermal Units) of energy in 2022.

Over 70% or 70 quadrillion BTUs were produced by fossil fuels. Suppose we do some simple math ignoring efficiencies, that represents about 20 million GWhs (Gigawatt Hours). That’s the amount of electric energy the U.S. will have to add of new renewable energy by 2050.
The National Renewable Energy Laboratory (NREL) did an extensive analysis of this problem. It said the U.S. will need about ten times the solar energy, twice the wind, and a whopping 100 times the battery storage capacity by 2050. Whew!
Can the grid handle this new energy reality?
The Grid Caught in the Middle – GIS Helps
Given the huge increase in renewable energy and storage and the corresponding increase in demand, the existing grid is caught in the middle. Historically, fossil power plants were built reasonably close to load centers. Developers plan and build utility-grade solar and wind plants in areas of low load demand but with high renewable resources. Those areas are often located in remote areas. That burdens the transmission planner in getting the newly created power to areas where consumption is most needed.
Deciding the best path from remote locations to the existing grid is one of the common applications of geographic information systems (GIS). The problem is often stated as “find the least cost path from point A (the location of the planned renewable energy source) to the closest existing transmission line.” GIS uses a process called spatial analysis to make that determination. It examines areas to avoid, such as waterways, tough terrain, culturally and environmentally sensitive areas, and places that may offer difficulty getting material to the site. It attempts to minimize expensive turns. It also brings in land ownership data to examine where land acquisition may be difficult.
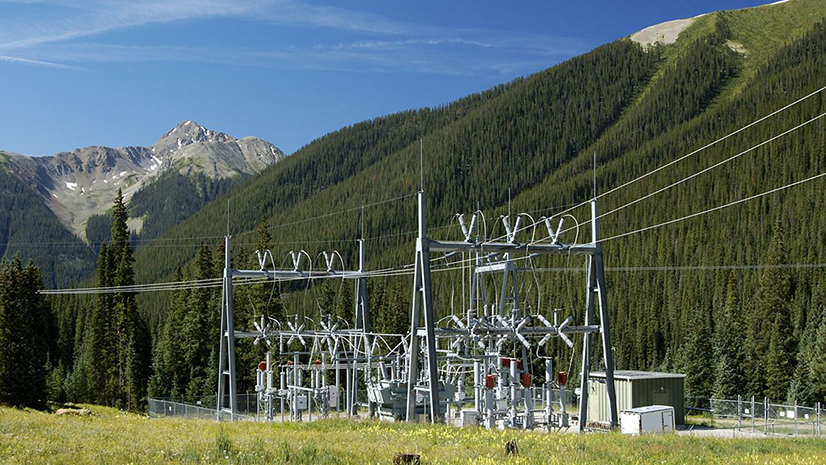
GIS has been the tool of choice for transmission owners and operators for decades. As well as routing. it is used for asset management, right-of-way management, inspection and facilities and asset management. It is also critical in the environmental determination, engineering, design, and construction management of new grid projects. GIS, then, will go a long way in helping planners in the tactical aspects of building out the grid.
What Happens When the Power Gets There? – Location Matters
Finding an optimal path from point A to B is only the beginning. The existing grid has been described as aging, congested, and fragmented. According to the recent U.S. Transmission Needs Study in October 2023, the Department of Energy’s (DOE) stated bluntly. “Today’s grid cannot adequately support 21st-century challenges – including the integration of new clean energy sources and the growing transportation and building electrification – while remaining resilient.”
While not often associated with GIS workflows, maps and GIS help planners determine the best location to shore up the existing grid. Transmission operators have used the Locational Marginal Pricing (LMP) concept for both Day-Ahead Energy Pricing and Real-Time Pricing. What is LMP? The key parts of the LMP are the places where the marginal wholesale prices are established or calculated. These places are called LMP nodes, and they occur at locations on the grid. LMP at the nodes consists of three pricing components:
- The price of the next increment of energy that would be added at that location on the transmission system. At each node for day-ahead forecasting, each hour of the day has a forecast. For real-time LMP, the values are the actual marginal cost, changing every 5 minutes.
- Transmission congestion costs. – this component accounts for how easy or not so easy the power can be delivered to the node in question, and that is translated into a cost. Congestion is due to areas within the transmission system where the capacity limits the amount of power that can be transmitted – in other words, bottlenecks, or transmission traffic jams.
- Losses – Similar to congestion cost, this cost is based on the losses incurred when delivering power along the grid. A key here is the model of the transmission system. The longer the path the power has to flow to get to a node, the more energy is lost in the form of heat losses.
Maps are useful tools for seeing the variations in LMP for day-to-day operations, but the concept of LMP for grid planning can be extremely helpful. In addition to the spatial aspect of GIS, it also provides a connected model of the grid, which is critical in determining congestion and losses.
LMP Using GIS a Tool for Grid Planners
GIS spatial analysis from historical records of LMP can determine the differential in locational pricing from one region to another. This difference in pricing will depend on the distance the node is from the generation sources. Note that the farther away the generation sources are from the node (and the demand at the node), the higher the losses will be and probably the congestion. If congestion and losses elevate the price, then planners can recommend either transmission upgrades, new parallel paths to relieve congestion, or perhaps adding storage near the load to lower the total cost. The planners can then balance new project costs with the ability to lower regional LMP, which translates into lower consumer costs.
GIS Helps Planners in a Variety of Ways
The grid will be the center of the greatest transformation of the electric industry since its inception. There are many participants in the U.S. grid. They include the transmission utilities, which own sections of the grid, Independent System Operators and Regional Transmission Operators (ISO/RTOs), various balancing authorities, grid planning organizations, power marketing administrations, such as BPA and WAPA, FERC, NERC, and the US DOE. Thus, all participants must collaborate to get the job done. Nearly every aspect of grid planning involves location. GIS will be at the heart of nearly every grid workflow. GIS is not just about mapping the grid and managing its assets. It is about gaining insight into its behavior in the overall context of energy pricing and the efficiency of the grid. It is about engagement – sharing data among the participants. No master plan created it. It evolved. Now more than ever, each participant needs to collaborate. Given FERC’s latest rulings 1920 and 1977, long-term planning for the future grid is critical.
Converting 70 quadrillion BTUs from fossil to electricity requires new spatial thinking. Location matters.
Learn about how GIS enhances all aspects of grid operations.