Authored by: Tomas Dorelis, IT, GIS, and Telemetry Process Engineer
When coming across the term “GIS technologies”, many people immediately think of mapping and management of networks. These functions are part of GIS, but GIS technologies have much more to offer. Processes such as geocoding and spatial data analysis may not be the first thing to come to mind, but they are important to day-to-day operations.
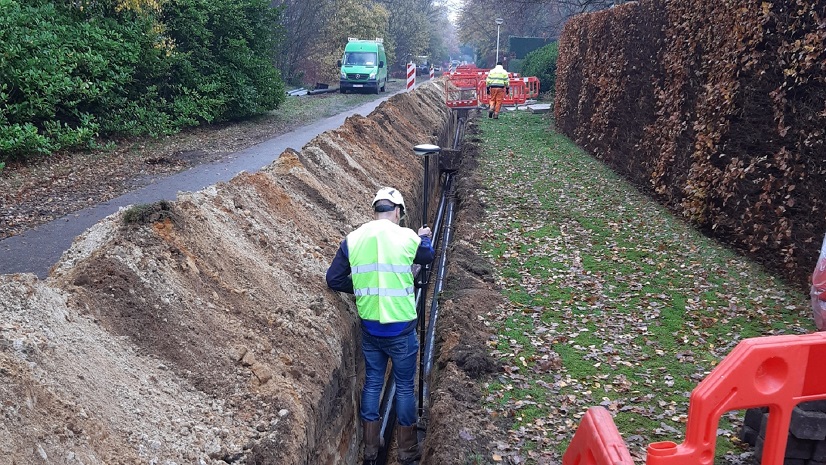
Kretingos vandenys is in Kretinga, a city in Western Lithuania. The company is responsible for the supply of drinking water and the treatment of wastewater throughout the district, managing a network of over 500 kilometers. It employs around 65 people and serves over 13,000 users. Kretingos vandenys has started using ArcGIS as an accident and work order system—a system built on Esri ArcGIS software for registering and managing malfunction events. However, the company is seeking more efficient workflows and is interested in identifying relevant ArcGIS extensions that can optimize its operations.

Geocoding Consumer Data
Geocoding is the process by which location descriptions in text (e.g., addresses or place-names) are converted into geographical coordinates (usually latitude and longitude) to identify a location on Earth’s surface.
Geocoding and spatial data analysis did not seem relevant to Kretinga until we saw the possibilities during a technical training session organized by hnit-baltic. The demo provided an understanding that immediately appeared to have a lot of potential to impact our work.
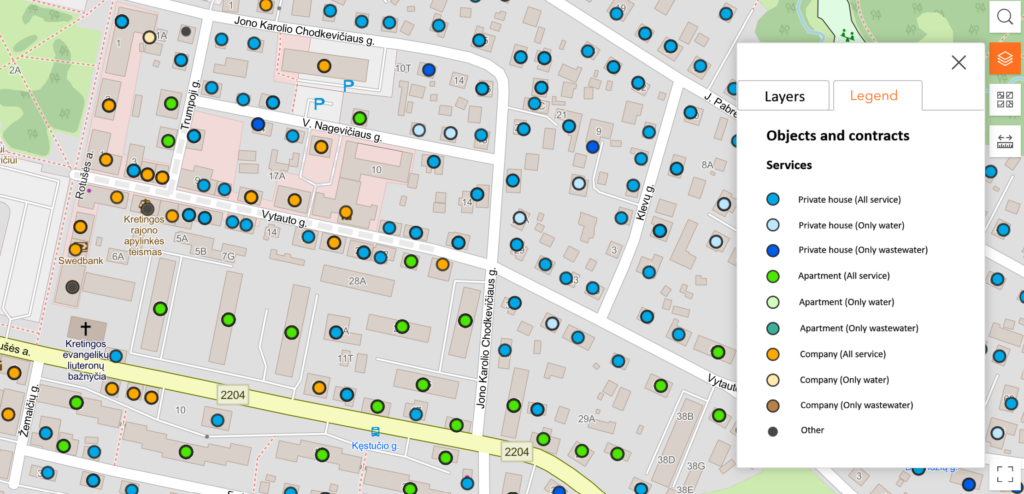
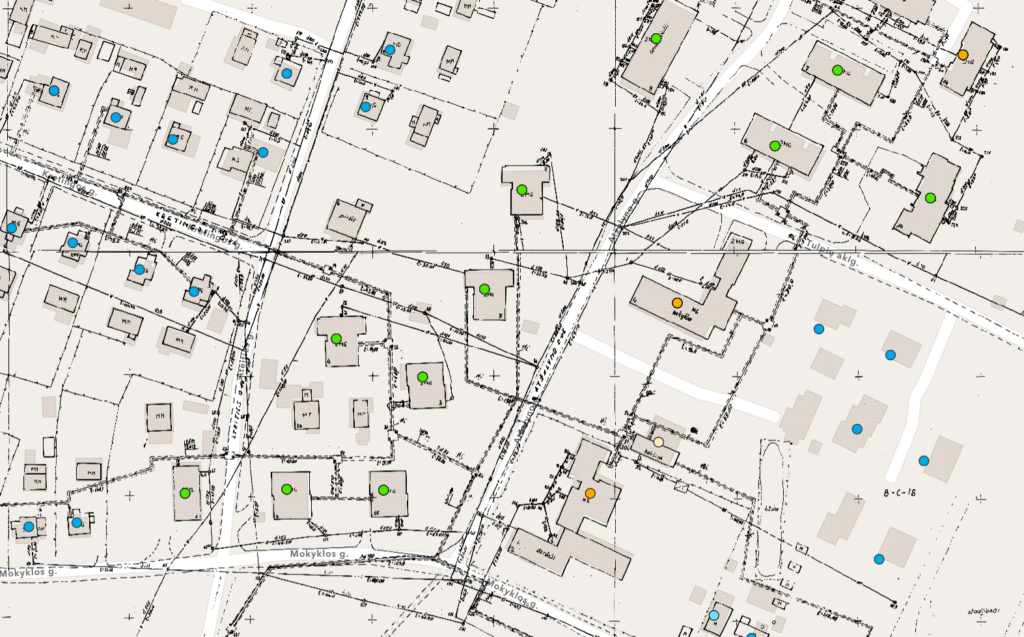
We used geocoding to create a consumer map. We started with a list of customer data. In our geocoding process, we ensured the accurate representation of data not solely through addresses, but by incorporating four key parameters: address, eldership, settlement name, and municipality name. This comprehensive approach enhanced the precision of the data visualization. Once the data was visualized on the map, we symbolized it to show what services customers were receiving. Additional data displayed on the map includes the customer’s full name, address, contract identification number, the effective date of the contract, and the type of services provided. This information is helpful in orchestrating further detailed analyses and customer service management. By doing this, we were able to quickly identify possible arbitrary connections or incorrect addresses in the database. This is not possible (or, at least, it’s very difficult to do) by looking at a list of data. The fast progress to convert addresses to users on a map was unexpected. Visualizing customer information on a map led to a deeper approach to spatial data analysis.
After viewing the map and seeing that there were incorrect addresses, we began working to correct them. Using open spatial data, we were able to import a list of addresses from the Public Register Center. By applying a spatial data analysis approach, comparing the data in our consumer map with the data from the Public Register Center, we have extracted non-overlapping objects. We have identified the objects which, according to our data, do not contain any of the services provided or the service contract (or they contain an inaccurate address on the contract). The analysis has identified a large number of addresses which are outside of our service area.
To better define the area where we are looking for discrepancies, we used our service area boundary with a buffer of 200 meters. In this way, we have eliminated all the addresses that do not impact our work and, therefore, are not used in our analysis.
This newly extracted data leads to three possible scenarios:
- The object has a service provided and the address is not the correct address in the contract. (The address has been changed by the Registry Office and the subscriber has not updated it.)
- The facility uses services, but has not concluded a contract with the service provider. Further evaluation needs to be done to determine if there is an illegal connection.
- The object has no contract or connection to our services.
In short, an unauthorized connection is detected. The analytics performed help to quickly and efficiently identify the objects that need more attention, including arbitrary connections and outdated address information that requires updating.
Spatial Data Analysis and Application of ArcGIS Tools
Now that we have various spatial data, we are looking for ways to facilitate various tasks, or how to use the data to create new processes that will allow staff to perform various tasks more efficiently. A better result than expected is often achieved.
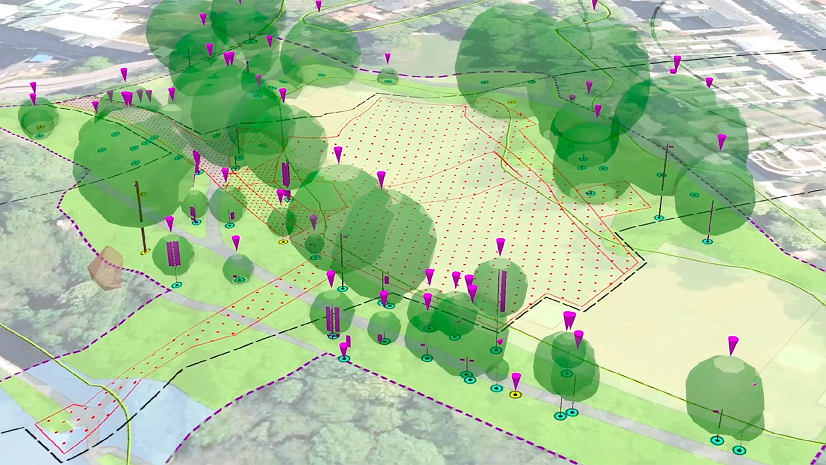
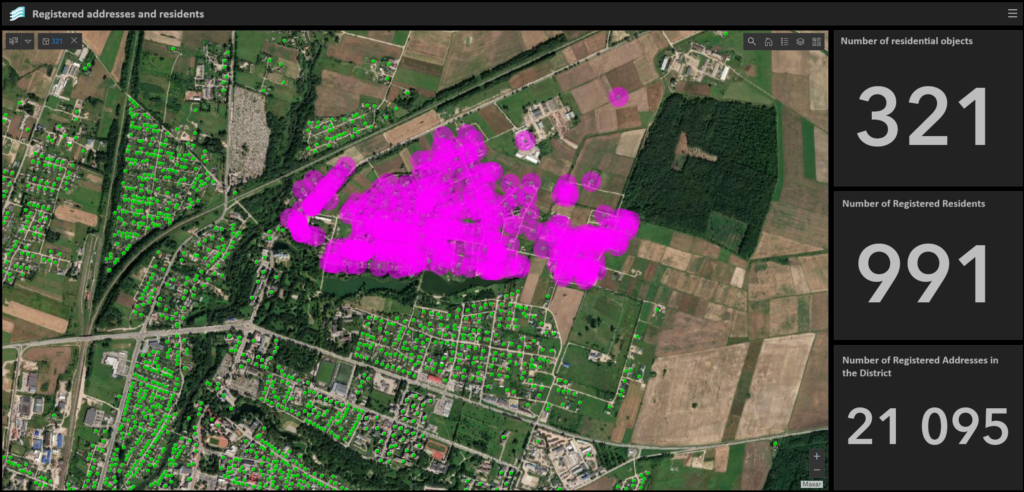
For example, we are using dashboards to better understand who will be impacted by development projects. The information created using geocoding, as described above, is being used within a dashboard to enable staff to draw a specific area on the map and immediately see who will be impacted by projects in their area. This is a very useful tool because we can quickly calculate the expected number of impacted users before development projects are finalized and executed.
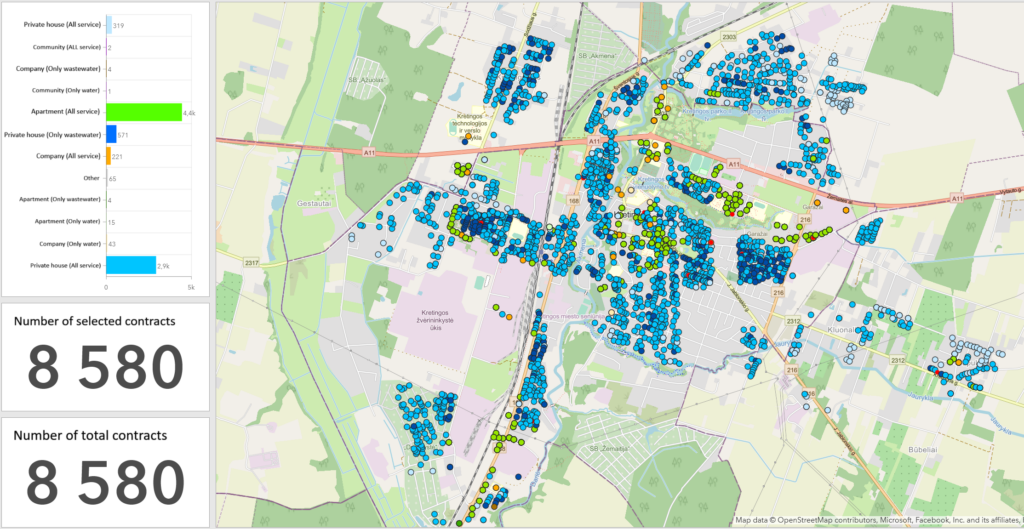
Spatial data analysis was also adapted for the purpose of counting contracts within the Kretinga City agglomeration. A very similar method to the previous one was applied for this analysis. Spatial consumer data was combined with Kretinga City agglomeration data (a polygon layer marking the geographical area around Kretinga City) and only those objects that overlap were selected—objects that fall within the marked area. The obtained result was also presented in a dashboard created in the ArcGIS Dashboards app. In this case, the dashboard aggregates existing contracts according to the services provided. The dashboard also allows filtering data by the desired contract type. For example, it is possible to select objects that only have drinking water supply contracts. By viewing the map, it is possible to identify the distribution of objects that do not have a domestic sewage disposal contract. This type of dashboard makes it possible to analyze the spatial distribution of services provided. Until such tools were available, processes such as counting existing users within the boundaries of a large urban agglomeration were performed simply by comparing the list of service delivery addresses with a map, and this could take up to a month.
GIS provides powerful tools for collecting and analyzing data from various profiles, and for creating diagrams and graphs. This assists in making informed decisions regarding infrastructure maintenance and planning. — Anatolijus Boguševičius, Head of the Water Supply Infrastructure Department
Digitizing Old Paper Maps
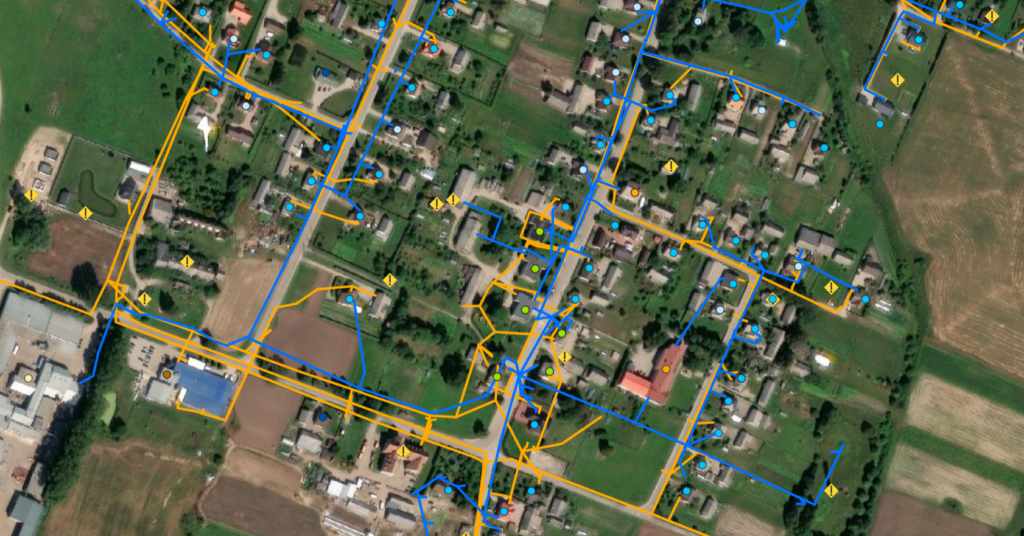
GIS creates comprehensive network maps that easily display pipelines, valves, hydrants, and other infrastructure elements, facilitating the identification and maintenance of faults. These maps improve collaboration among different departments by providing everyone with equal access to real-time information. — Anatolijus Boguševičius, Head of the Water Supply Infrastructure Department
A successful project is underway to digitize old paper maps that are approximately 30 years old. This is particularly important as there is no newer information available, and these maps are an irreplaceable source of information. ArcGIS software and its Georeference function are used for digital conversion. The resulting digital maps are stored in a GIS portal, ensuring convenient access for everyone who needs this information.
Digitized maps offer many advantages:
Accessibility—Instead of a single paper map that is kept in the office and can only be accessed by a limited number of people, everyone can now freely access the information they need, even when away from the office.
Convenience—Large-format paper maps (7 meters x 60 centimeters x 7 units) are not always convenient to use. Digitized maps are easily accessible and viewable even on mobile devices such as phones.
Fast Search—Information can be found and viewed much faster in the digital realm than on paper maps.
Digitized paper maps not only improve information accessibility and convenience, but also make it easier to navigate and make better decisions.
Embracing the Future with ArcGIS
As we strive for continuous improvement, we are constantly seeking new ways to adapt ArcGIS to our needs and uncover the untapped potential of this powerful software. One of the best ways to achieve this is to participate in the online training courses offered by Esri. In these training programs, you will not only gain valuable knowledge on how to perform specific tasks, but also discover the diverse features and hidden gems of ArcGIS that can transform your work.
Kretinga Waters achieved significant operational efficiency improvements using ArcGIS technology. This software helped accurately visualize customer data on a map, allowing precise identification of discrepancies and targeted work organization. Spatial data analysis simplified work processes by reducing the need for manual comparisons and saving time. Continuous training with Esri enables our employees to fully utilize the potential of ArcGIS. In summary, ArcGIS has become an essential tool in optimizing our operations and making informed decisions. — Eglė Alonderienė, Director – Kretingos Vandenys
Stay Connected with Esri’s Water Team
ArcGIS is an extensive information system that enables modernization of workflows with easy-to-use applications for the field and office. Strengthen your organization with smart water solutions that will increase efficiency and provide insight for decision-makers.
Visit the Esri Water Utilities web site for more information.
Follow #EsriWater on social media: X| LinkedIn
Subscribe to the Water Industry newsletter “Esri News for Water Utilities and Water Resources“
About the author