Most recent
Turning Recommendations into Action: Why the Alliance for Wildfire Resilience’s Legislation Tracker Matters
Turn insight into impact. This ArcGIS-powered tracker maps wildfire bills to expert recommendations for smarter, faster change.
Urban Public Utility Gains Efficiencies with Digitized Permitting and Asset Management
Salt Lake City Department of Public Utilities has improved efficiency and increased transparency using dashboards and interactive maps.

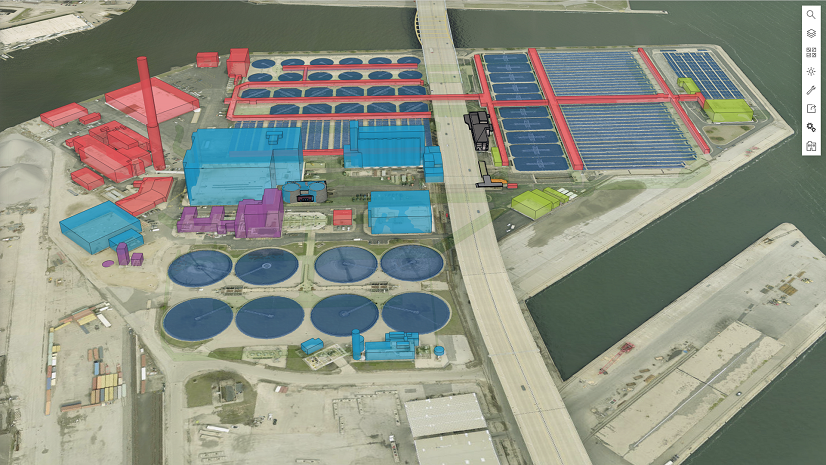
Águas do Norte: GIS Integration Strategy Using ArcGIS Utility Network
Águas do Norte strategically aligned GIS initiatives to ensure that all departments benefit from geospatial data and increased efficiency.

Faster Fixes, Smarter Apps: NES Transforms Storm Damage Workflow
ArcGIS and Epoch solution provides a centralized repository for storm damage data, streamlining the process of assessing and tracking damage.

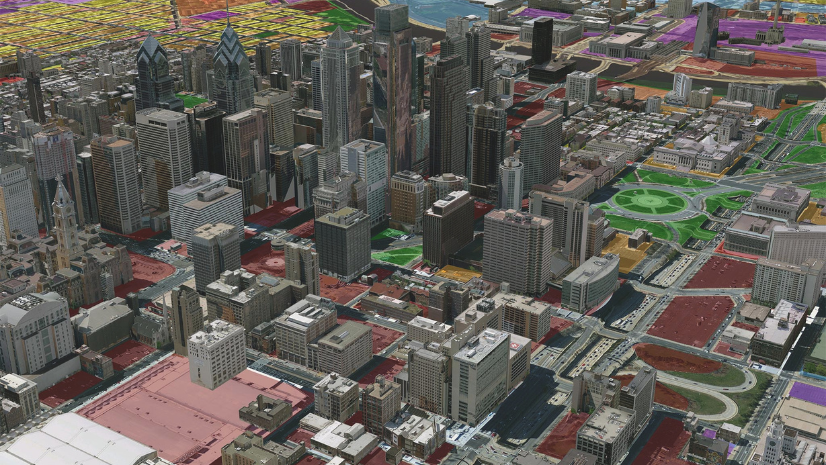
What the New User Types Mean for Planning Departments
How does the new user types in ArcGIS affect those working in planning?
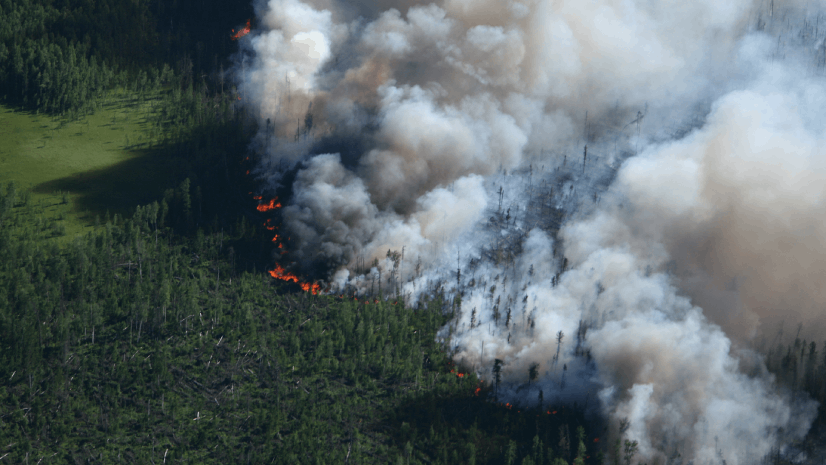
What’s Burning and Where: Apps and Insights to Stay Informed
Stay informed this fire season with trusted apps and tools to track wildfire activity, assess risk, and boost situational awareness.
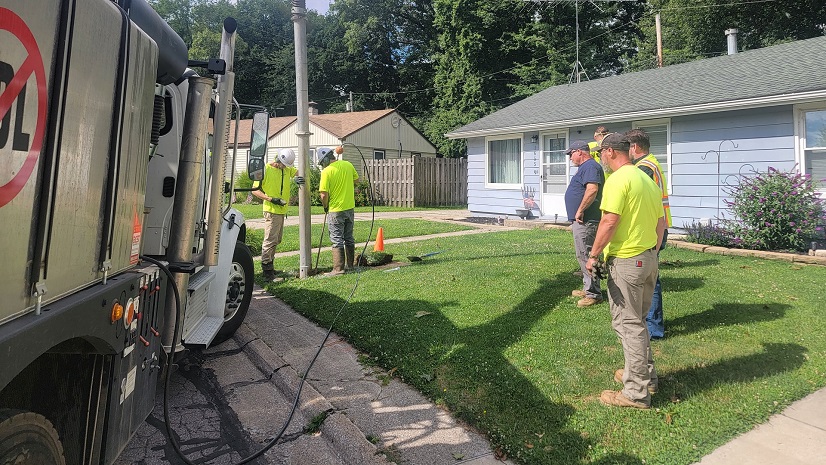
Building Transparency and Added Value into Lead Service Line Discovery and Replacement with GIS Solutions
Indiana utilities partner with Abonmarche to implement GIS solutions, helping them meet EPA LCRI requirements and improve daily workflows.
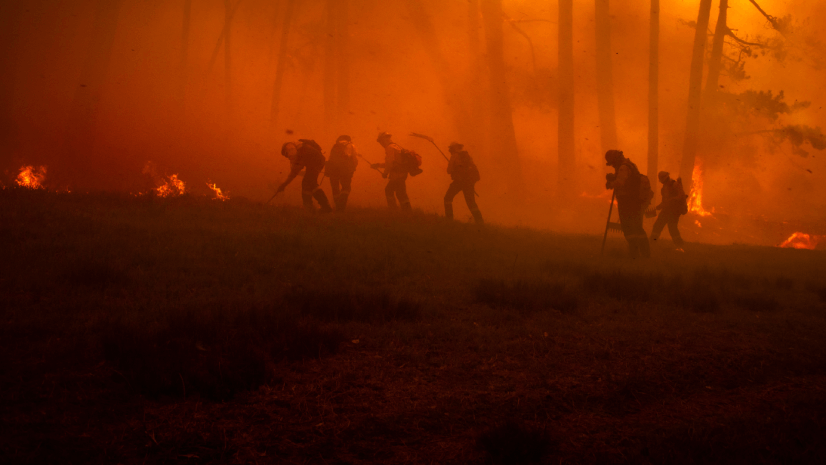
Your Wildfire GIS Guide for 2025 Starts Here
Kick off fire season with the top GIS tools for tracking, planning, and staying informed. Your 2025 wildfire guide starts here.
Beyond Epi Info: Embracing the Next Generation of Public Health Analytics with GIS
As CDC sunsets support for Epi Info, we explore what the next generation of public health analytics will be.
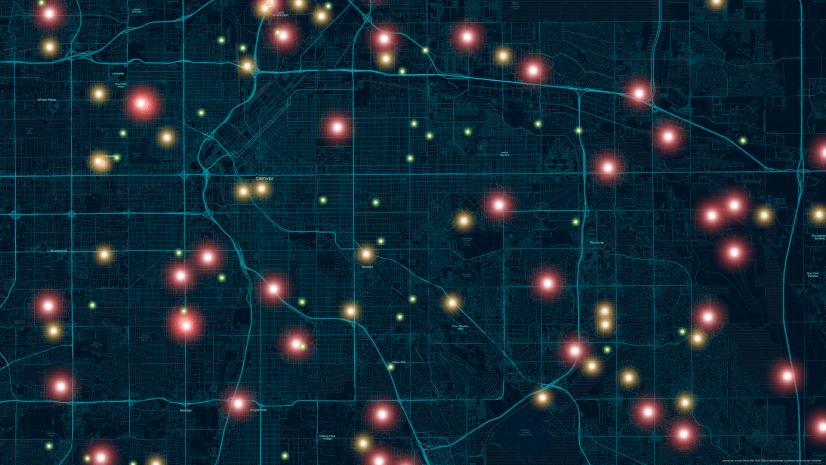
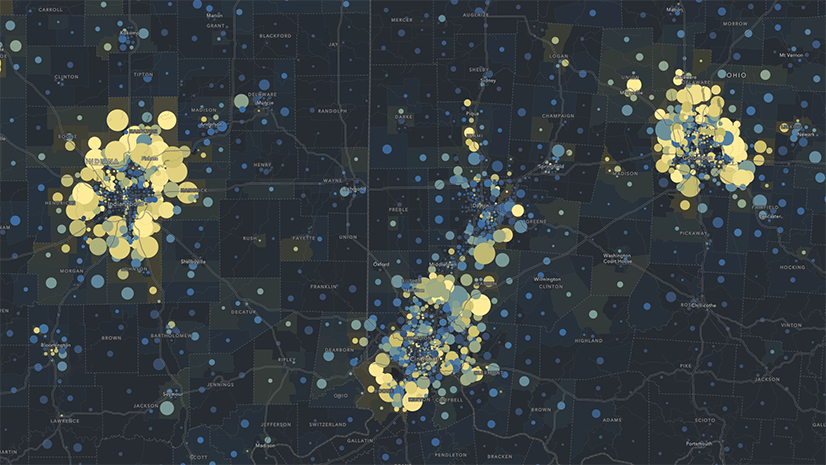
Mapping Accountability: A Geospatial Approach to Combating Fraud, Waste, and Abuse
Fraud happens somewhere. GIS reveals where—and why—so agencies can prevent loss, protect resources, and promote accountability.
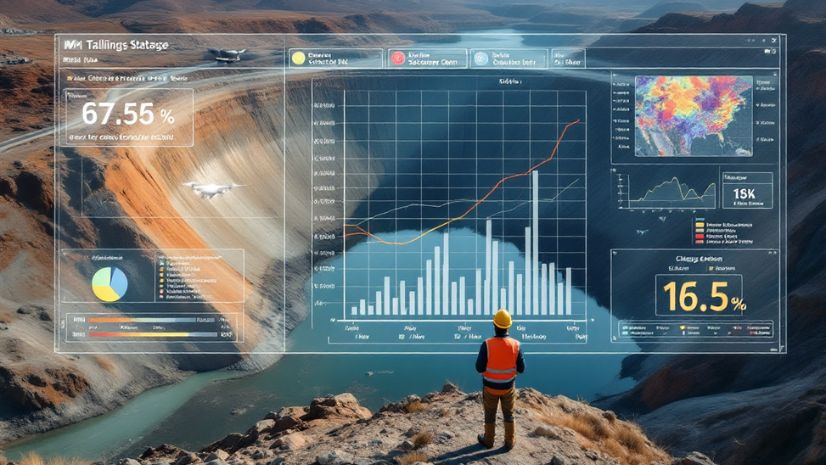
Inside the Dashboard: A Look at Real-Time GIS for Tailings Management
Real-time GIS dashboards transform tailings monitoring with sensors, drones, and field apps—enabling smarter, safer decisions.

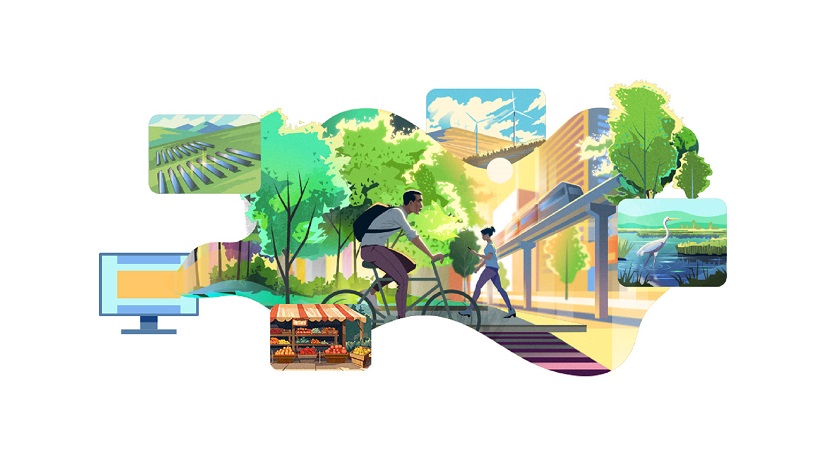
Shaping the Future of Energy with ArcGIS
Energy Resources GIS Conference Recap

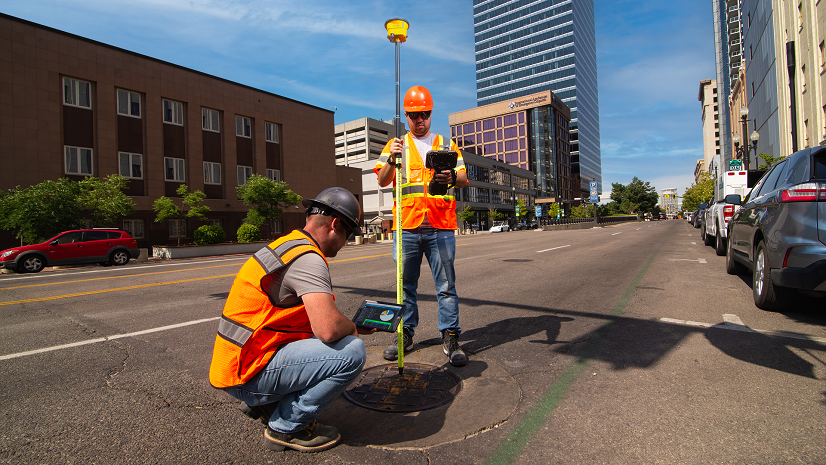
Streamlining Stormwater Outfall Inspections with GIS Solutions
GIS-based solutions modernize outfall inspections and lead to more efficient and transparent work across the City of Rockford.