Most recent
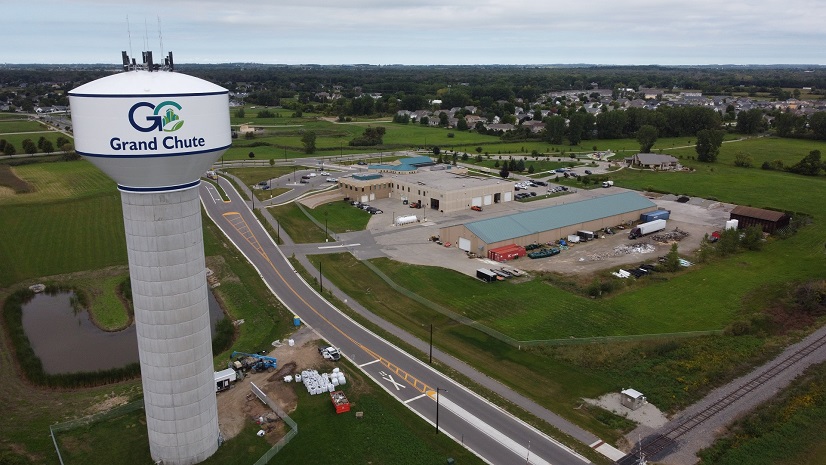
Esri Brings Next-Gen Public Works to PWX 2025
PWX 2025 in Chicago was our best yet. Packed with tech demos, partner booths, and energized conversations about the future of public works.
Madison Musgrave|
Mapping Open Spaces for Disaster Response

Facsa’s GIS Journey: From Paper Maps to a Spatial Digital Twin

On the Way to the Connected Digital Twin: DB Systel Relies on GIS and Location Services

Empowering the Future of Environmental Consulting with Geospatial Innovation
Rebecca Kahrhoff|
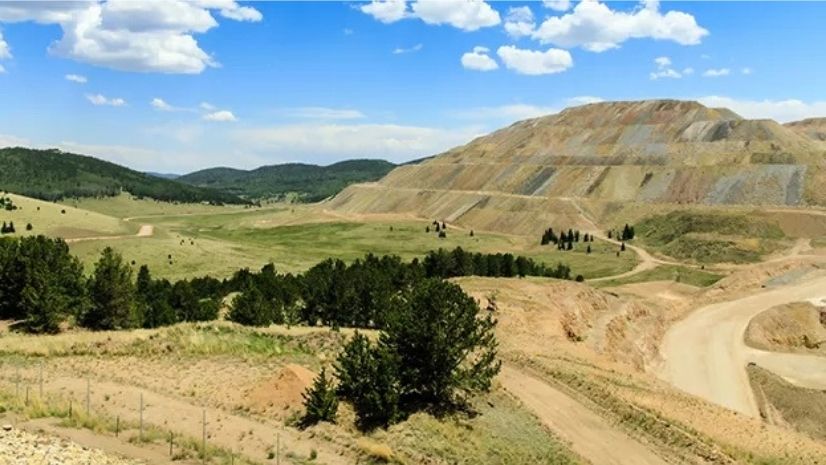
Mapping for Mine Closure: Why GIS is the Key to Sustainable Reclamation
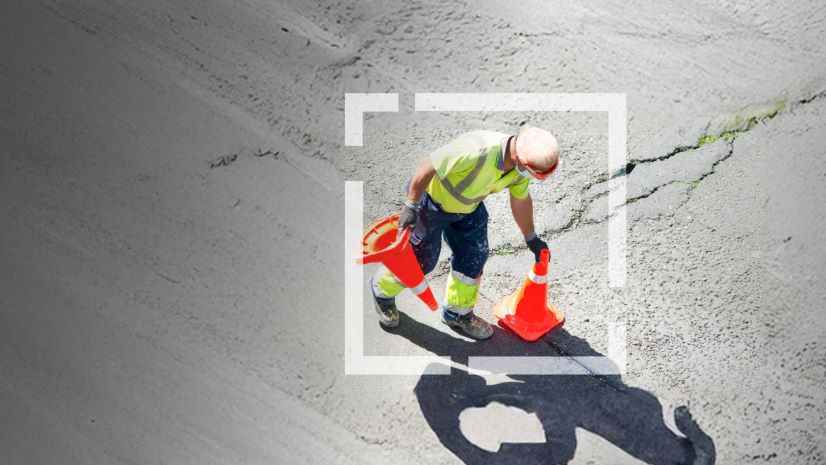
Headed to APWA’s PWX? Stop by Esri to Learn How Next-Generation Public Works is Powered by ArcGIS
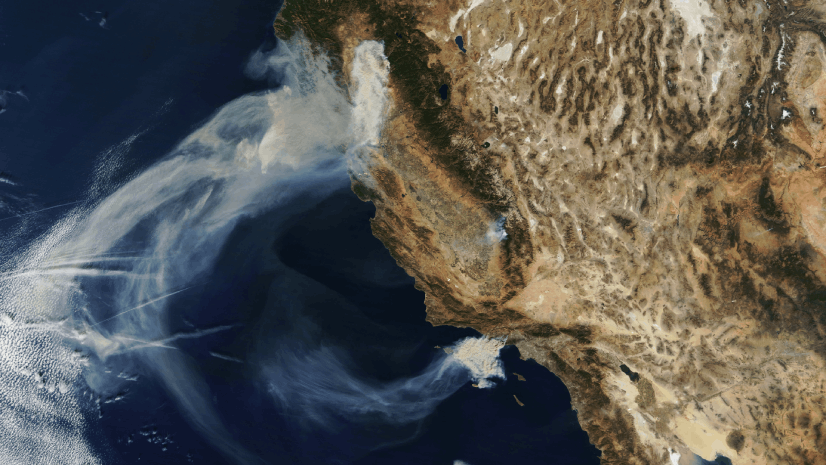
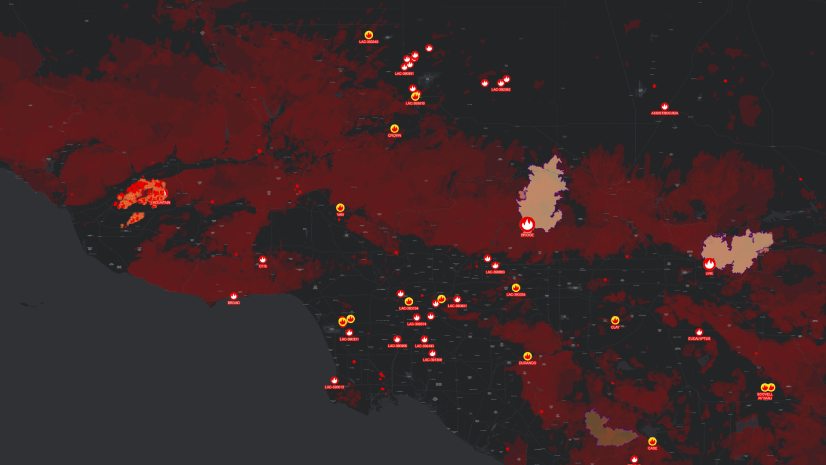
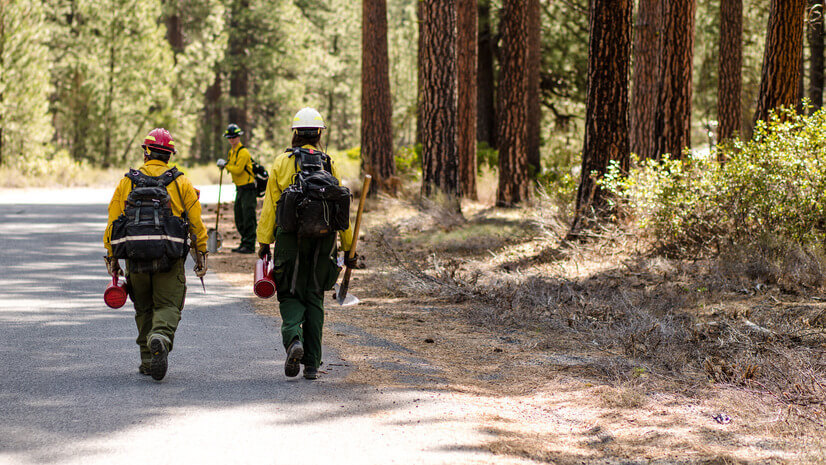
Seeing the Big Picture: Remote Sensing in the Wildfire Technology Toolkit

Showrooming: At a Grocer Near You.

ICSC Las Vegas 2025: Retail’s Data-Driven Evolution
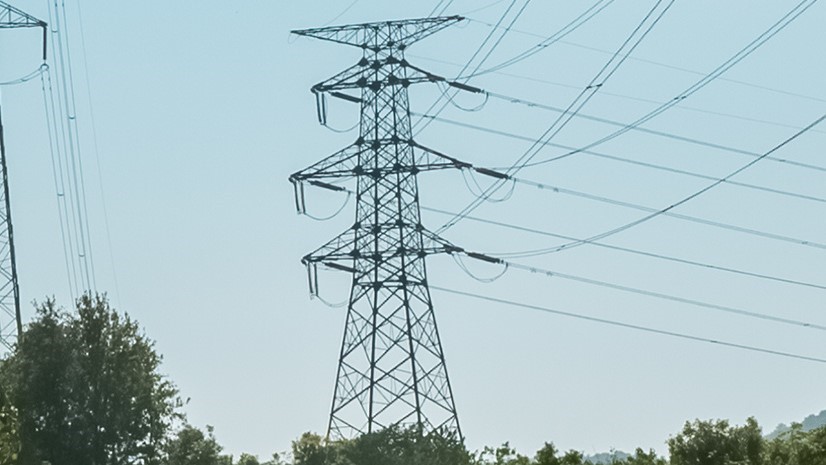
GIS-Powered Precision at Great River Energy: Fault Location Transformed

New State Legislation Reshapes Housing and Community Development