The Orange County Sanitation District (OC San) is a public agency that provides wastewater collection, treatment, and recycling services. Approximately 2.6 million people living in a 479-square-mile area of central and northwest Orange County, California, benefit from their services. OC San is a special district governed by a board of directors consisting of 25 board members appointed from 20 cities, two sanitary districts, and two water districts, and one representative from the Orange County Board of Supervisors.
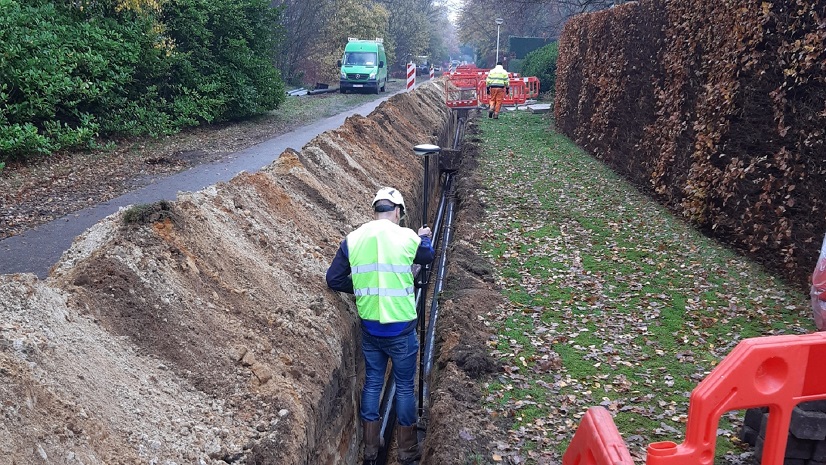
OC San’s collections system includes nearly 388 miles of regional sewers, over 4,500 maintenance holes, 15 pump stations, and two wastewater reclamation plants (each approximately 100 acres) treating more than 190 million gallons of wastewater a day from residential, commercial, and industrial sources. OC San provides 100 percent of its reclaimable wastewater to the Orange County Water District for its partnership program, the Groundwater Replenishment System (GWRS). GWRS is the world’s largest water purification plant, producing up to 130 million gallons of high-quality water every day. It provides a locally controlled, drought-proof, and reliable supply of high-quality water in an environmentally sensitive and economical manner to meet the needs of nearly one million residents.
The Technology Landscape at OC San
OC San’s Enterprise Information Management (EIM) team was created to compile all construction project information in one place. Staff responsible for GIS, CAD, and asset management had previously resided in separate departments: information technology (IT), operations and maintenance (O&M), and engineering. Joining staff from these departments under one umbrella resulted in immediate benefits because the teams share the common goal of processing project data into operational information used by engineering and O&M.
The continuous updating and authenticating of datasets and related engineering drawings support management of the collection, treatment, and recycling of wastewater.
The primary responsibilities of the EIM team include:
- Maintaining application models of the location of facilities and equipment using GIS.
- Maintaining an accurate representation of the electrical systems using single-line diagrams (SLDs).
- Showing the interconnection of process equipment and instrumentation using piping and instrumentation diagrams (P&IDs).
- Updating AutoCAD engineering baseline drawings from GIS databases.
- Managing the listing of assets in the enterprise asset management system.
These responsibilities mandated the creation and adoption of modern, smart technologies and solutions. The team uses Autodesk, Esri, and IBM solutions. AutoCAD is the standard software used by OC San’s design consultants and internal engineering staff. Esri’s ArcGIS platform is being used to provide informative maps and applications. IBM Maximo was chosen for enterprise asset management.
OC San participates in Esri’s Enterprise Advantage Program, which ensures that they continue to take advantage of the many products and services Esri provides. This was one of many steps taken to authenticate and develop their critical business systems. A field-based approach was used to validate data, primarily leveraging maintenance and engineering staff. Processes and workflows were developed to transform the way things were done so that OC San’s EIM team could support increasing responsibilities across the organization. Processes were established between EIM and engineering to ensure that all project information was provided to EIM during the project life cycle, keeping models and systems up-to-date. This is imperative since OC San has close to 100 active capital improvement projects at any one time. Additionally, workflows were developed with O&M to ensure information was captured when changes were made in the field, and to correct discrepancies. These processes and workflows have been consistently used for many years and are key to the accuracy and integrity of data.
Building a Foundation for Digital Workflows
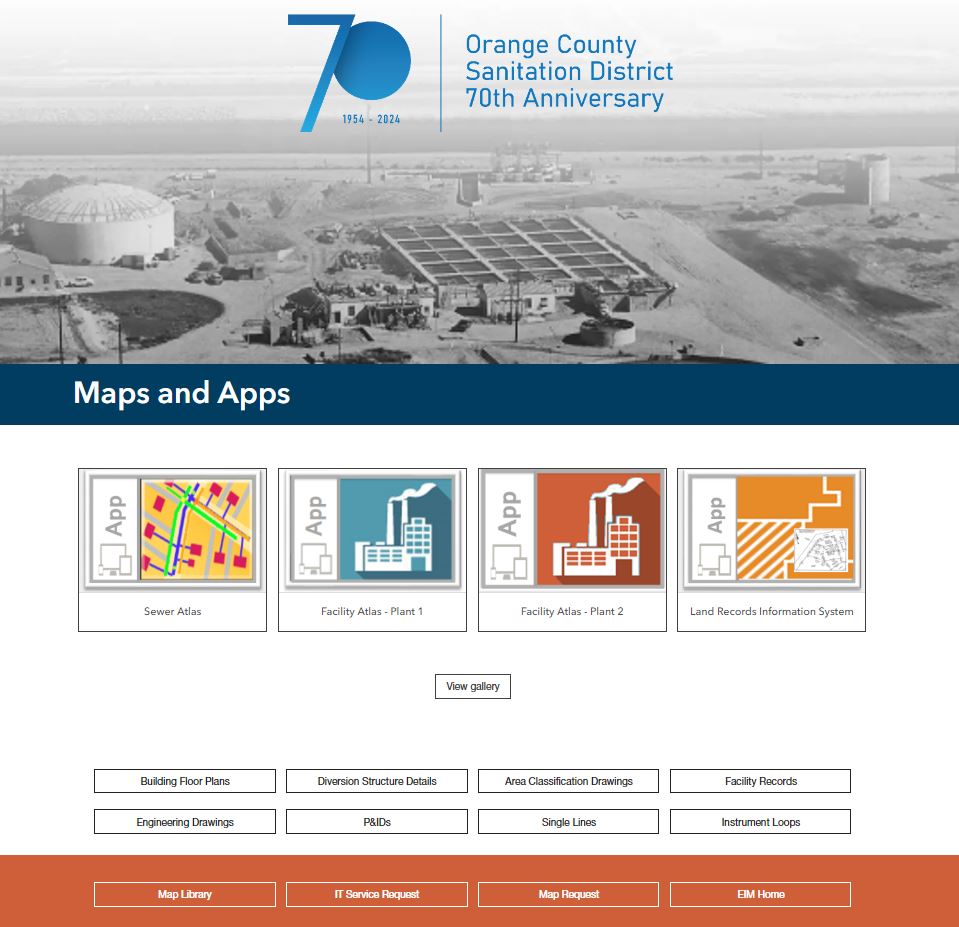
The Facility Atlas and Sewer Atlas, web-based map applications of the treatment plants and collections system, have been available for approximately 20 years; however, the information stored in these systems was limited. Information that is vital to the operation of the treatment plants and collection system, such as the piping and instrumentation diagrams (P&IDs), single-line diagrams (SLDs), and asset management system, were treated as disparate data sources. Each had its own access points on various intranet pages under different departments. EIM centralized access to the data using ArcGIS Enterprise portal.
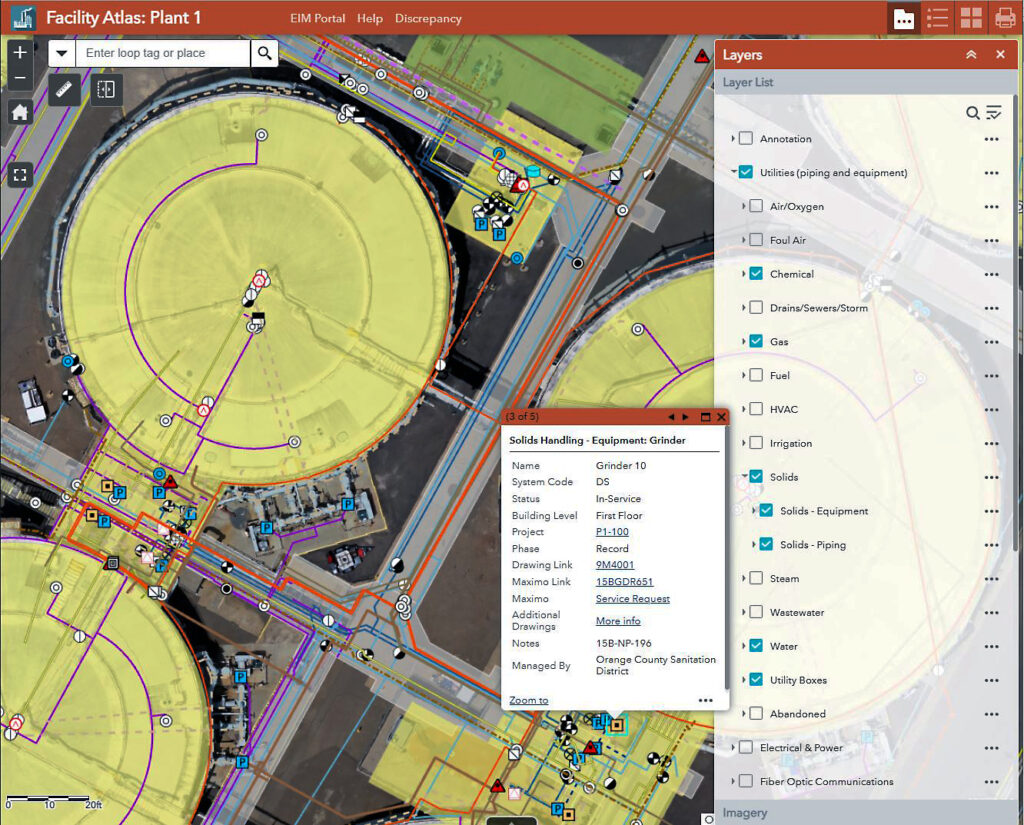
While this was an improvement, there was very limited integration between the systems. A common attribute exists in GIS, P&IDs, SLDs, and the asset management system. At OC San, this is known as “looptag” and it identifies a location, function, and subsystem (note: it is not an asset ID). Unfortunately, the GIS was not fully populated, and so an effort was made to backfill data and keep it current moving forward.
Once populated in GIS, the looptag attribute was key for integration with the other systems. The Facility Atlas and Sewer Atlas became the one-stop shop for information, integrating Maximo asset management data and work histories, CAD drawings and diagrams, and other information on specific assets in one place. Users can easily navigate through facilities on a map to select assets and view associated information like construction diagrams, work order information, CCTV videos, field photos, and GIS attributes.
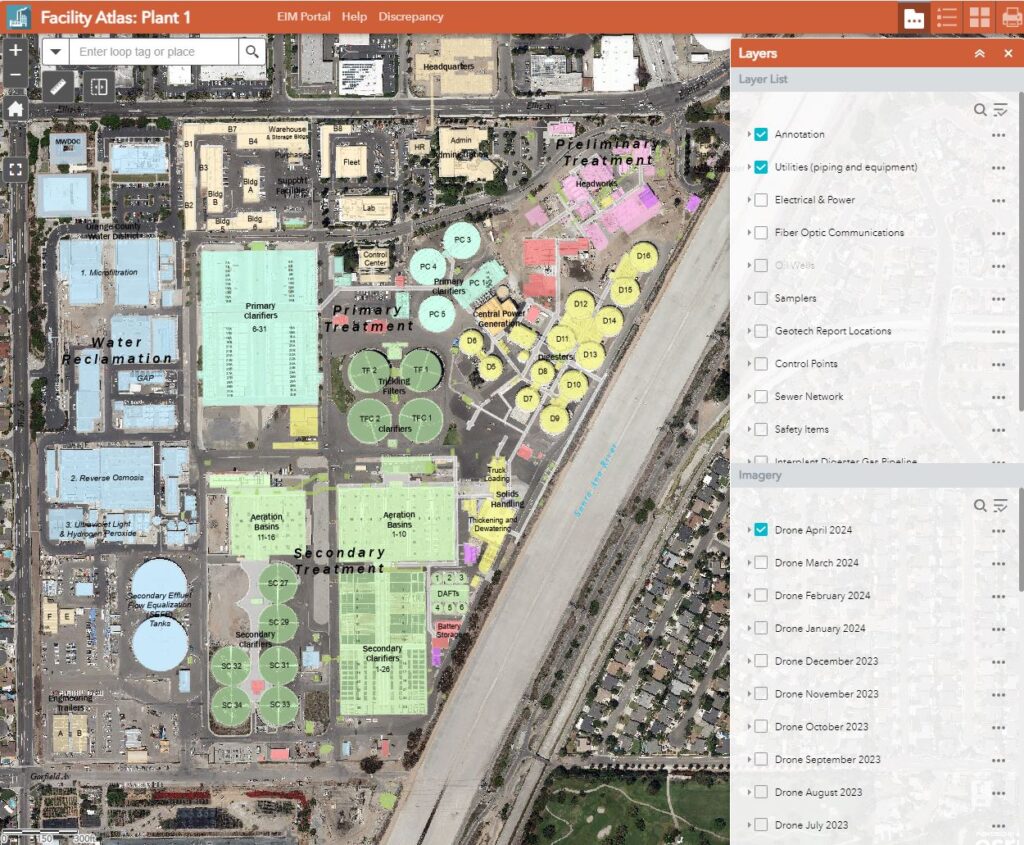
The information maintained in the atlases is constantly being updated. Last year, OC San had over 90 active construction projects in various phases of the project life cycle. To provide the engineering and O&M departments access to the most current information, the atlases are updated at two phases of a project. The first update is prior to construction or conformed plans. The second update occurs when the record drawings are complete. The CAD files from the design drawings are used to digitize the information. Project information such as project number and sheet number are recorded and attributes for each feature are digitized and then hyperlinked to the electronic document management system, providing access to the entire drawing set and to the individual drawing used to digitize the feature.
As OC San moves to a paperless environment, all project drawings are hyperlinked to make the process easier for users of the drawings. The drawings have navigation buttons on each sheet to move forward and backward and a link to the index sheets. All drawings listed on the index sheets are hyperlinked and callouts for detail drawings, section drawings, and drawings listed in construction notes are also hyperlinked.
By integrating modern business systems and creating streamlined workflows, OC San has enabled access to asset information across the organization. OC San has adapted to a changing world, and the workforce is now more informed and more efficient.
The data in the Facility Atlas and Sewer Atlas is the foundation for other applications such as underground service alerts, hydraulic modeling, land records, and construction and staging locations.
Supporting Organizational Initiatives
High-Flying Solutions: Data Collection with Drones
EIM staff needed current imagery to improve data quality and to be more efficient, so OC San started a drone program. The adoption of the program was accelerated by the COVID-19 pandemic, which caused OC San’s workforce to quickly shift to a work-from-home pattern. During the pandemic, on-site visits by staff, consultants, and contractors for capital improvement project job walks were limited. Because of this, OC San needed a new workflow to collect data for future projects. The EIM team worked with the engineering and purchasing departments to implement a program using drones and GoPro cameras to collect project location videos, including imagery from inside the process areas of the reclamation plants, within tunnels, and inside interior areas. The video content was then published on a private YouTube channel as a virtual job walk for contractors.

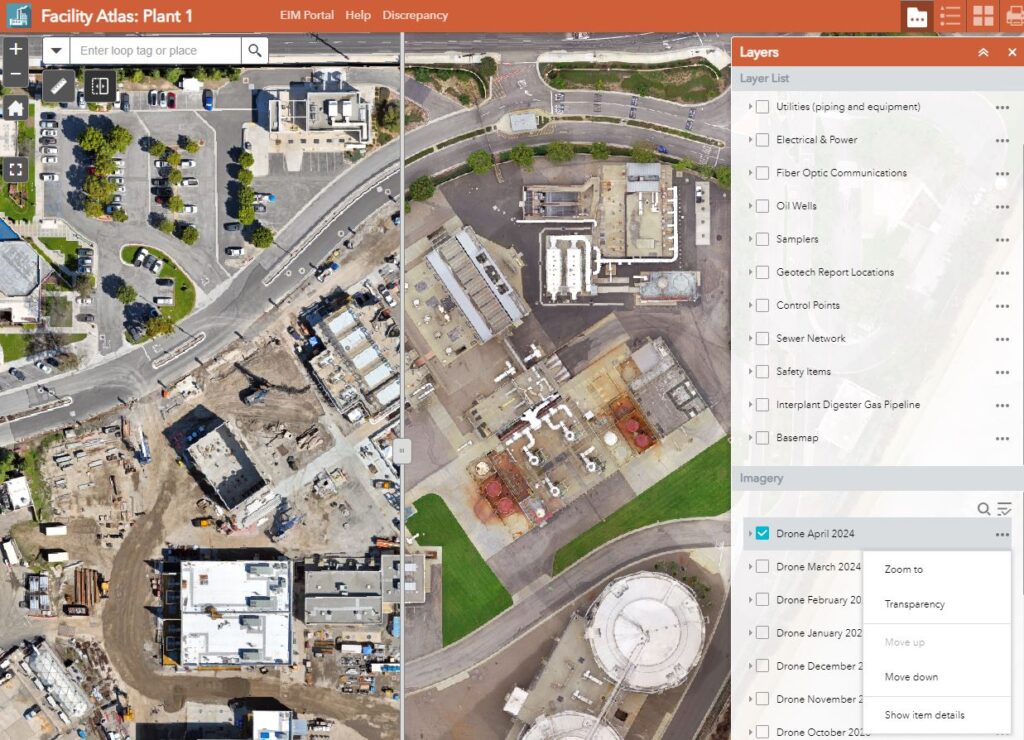
Drone-enabled data acquisition facilitates better project management and tracking capabilities. Once a project is in construction, drones are flown monthly to provide updated imagery for valuable insight and understanding of a project’s status. Drone flight paths can be saved, enabling consistent data collection across the spatial extent of the project. The ability to capture imagery over time enables OC San to maintain reliable information about changes to their facilities and assets, validate record drawings, and resolve contractor disputes.
Drone workflows have also been created for many day-to-day operations, such as physical inspections of hard-to-reach areas, like roof drains, that have posed a risk to personnel in the past. This has reduced risk to employees and provided imagery that can be reviewed as needed. Recently, a drone was flown inside a clarifier to assess the condition of the structure and equipment. The drone program has resulted in many opportunities for sites, facilities, and assets to be inspected via drone technology. OC San also utilizes drones to fly monthly orthoimage missions for each of its treatment plants. Images are created monthly with high spatial resolution, 0.66 inch/pixel GSD, and added to the Facility Atlases. Both the Facility Atlases and the Sewer Atlas serve as unique environments for interacting with all drone imagery in a map, allowing for information analysis.
Protecting the Environment: Ocean Monitoring Ensures Water Quality
A small portion of treated wastewater that is unreclaimable is released into the Pacific Ocean, five miles offshore at a depth of 200 feet. To ensure that the marine environment and public health are protected, OC San has maintained an extensive Ocean Monitoring Program (OMP), logging over 40 years of sampling data. The core monitoring phase consists of conducting marine population assessments (fish and invertebrates); fish tissue contaminant analysis (seafood safety); checking the ocean bottom (mud) for chemical contaminants; water quality assessments; and wastewater and sediment toxicity testing. The regional monitoring phase consists of coastal marine studies in cooperation with other entities throughout the Southern California region. In addition, weekly surf-zone samples are collected in ankle-deep water at 38 stations along 21 miles of beaches to assess water quality. The results are transmitted to Orange County Health officials, who determine the potential public health risks. The OMP’s results are also published in the Marine Monitoring Annual Report, which relies on GIS to produce its map graphics. The reports are provided to regulators, the scientific community, and the public. OC San has an IT liaison for Laboratory Information Management System (LIMS) software integration and dedicated GIS users to map sampling results.
Understanding Flow: Identifying Pollutant Sources
OC San’s Resource Protection Division (RPD) is responsible for a pretreatment program that protects wastewater treatment facilities, collections systems, and the ability to reclaim and reuse treated wastewater and byproducts. The program’s goal is to limit discharge of toxic pollutants from businesses and industries that might harm or interfere with the regional collection system, the treatment and reclamation facilities, or final ocean discharge. Using the Wastewater Discharge Ordinance as a foundation, staff enforce compliance through wastewater discharge permits, field monitoring, inspections, and source identification investigations.
RPD uses GIS to optimize evaluation of both new discharges and source investigation planning. RPD hosts an internal GIS team to proactively develop and manage program features and attributes, so the division is poised when new investigative tasks come about. RPD’s GIS team routinely collaborates with the EIM team to ensure alignment with OC San’s GIS strategic plan, as well as to ensure organization-hosted GIS features consider and provide RPD-required information and vice versa.
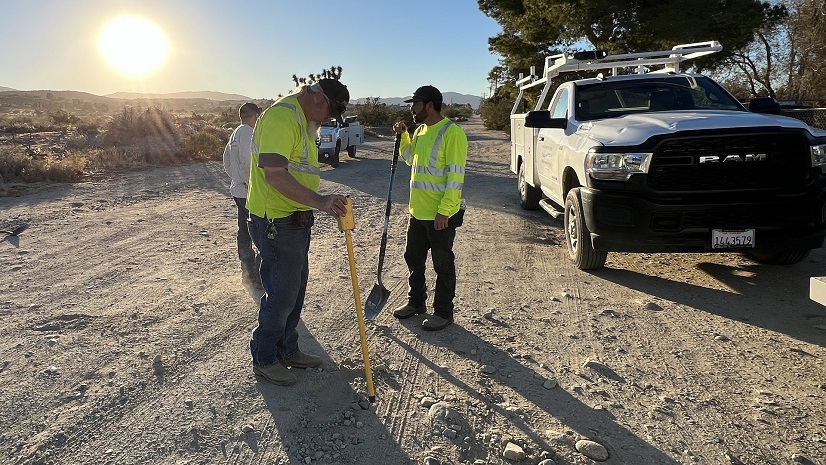
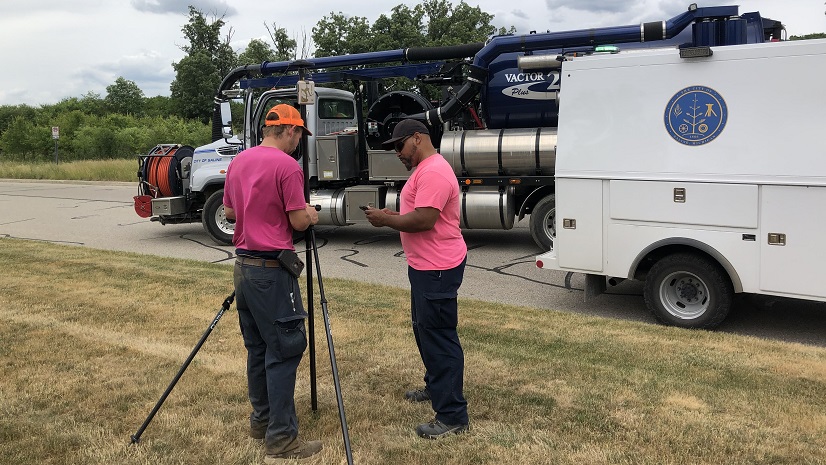
RPD staff use accurate and complete sewer data features supplied by OC San’s local sewer agencies and internal regional sewer features to trace sewage flow. Recent use of this data includes work in the wastewater epidemiology arena when sample collection locations were determined using geospatial analysis of parcel land use near areas of sub-sewer sheds identified using flow traces of the sewer network. Staff also use tracing to identify co-located dischargers (permitted and nonpermitted) during source identification investigations that aim to reduce and eliminate pollutant discharges impacting the treatment facilities.
GIS is also used to improve planning for site visits, reducing time spent out of the office. Prior to GIS use, staff would have to spend considerable time in harm’s way conducting field exploration—often in traffic lanes—to determine where to bracket land spaces that could pinpoint pollutant dischargers. Using facility point features, enterprise sewer information, annual high-resolution aerial imagery sets (3-inch/pixel), and land use information, RPD staff can more safely identify and evaluate a short list of field locations where investigation and sample collection is needed, then efficiently bracket collection system regions. Recent work includes efforts to identify pollutant sources which might impact facilities under certain operating conditions.
Agency-wide Benefits from GIS Technology at OC San
All OC San staff benefit by using GIS. In addition to the examples shared above, the EIM team uses GIS to support staff in a variety of ways:
- Providing shared sewer and storm drain asset data with local member cities, water districts, and county agencies within and adjacent to the service area.
- Maintaining links to maintenance hole connection permits.
- Annually updating county parcel, transportation, airports, jurisdictional, land usage, and cultural and demographic layers; city/county boundaries; and hydrology data for map making and analysis.
- Maintaining a historical library of county-wide digital 3-inch pixel resolution orthophotography imagery and monthly georeferenced 0.66 inch/pixel drone imagery of OC San’s two treatment plants. Imagery is used daily by collections field staff to locate maintenance holes; by engineering staff to audit construction phases; and by accounting staff to analyze permitting rates for residents.
- Providing a custom application to view treatment plant construction and staging information. The information can be searched by project number or dates and is linked to the engineering project information through Power BI.
- Providing a custom application for collections field crews to view where sewer line cleaning routes are, plus a report of which routes have been cleaned.
- Providing mobile access to GIS data for staff to locate sewer assets and mark for DigAlerts.
- Digitizing land record locations such as easements, annexations, service area boundaries, and construction permits in a searchable application.
- Maintaining data layers of odor/corrosion control, chemical dosing sites, and sewers.
- Supporting the Risk Management and Safety Division by providing layers in atlases for hydrants, fire alarms, eye wash stations, staff assembly areas, and hard-copy maps (earthquake line/tsunami and hazardous waste locations for local fire departments and emergency response) at the treatment plants and collections system pump stations.
- Supporting staff collection of sample data in the field.
- Mapping where OC San biosolids are trucked to and managed.
- Creating construction location and detour maps for community outreach.
- Sharing a GIS database with engineering project design consultants.
- Offering a resource for staff members to find coworkers to rideshare/vanpool with.
OC San has several ArcGIS Pro power users throughout the agency and its own GIS Users Group. Aside from the EIM team, the Ocean Monitoring Program and the Resource Protection staff leverage and create their own GIS databases.
The Road Ahead: What’s Next for OC San’s EIM Team
As EIM continues to move towards modernization of data management, they will mobilize the Facility and Sewer Atlases via ArcGIS Online, improve collaboration by including additional staff/teams, incorporate GIS data and maps into Power BI, and explore the use of Esri ArcGIS Dashboards and ArcGIS Insights to showcase data analysis. In addition, the team will work to configure GIS-based apps for data collection from the field, data verification, and inspection for sewer easements.
A significant project on the horizon is the development of an ArcGIS Utility Network implementation plan and pilot project. The team will engage Esri experts to help with this via Esri’s consulting services. They will also be moving towards 3D facility modeling as a result of updated CAD compliance standards.
For more information about OC San’s EIM team and GIS program, contact EIM supervisor Michael Hino at mhino@ocsan.gov. Follow OC San on social media @OCSanDistrict and learn more at www.ocsan.gov.
Stay Connected with Esri’s Water Team
ArcGIS is an extensive information system that enables modernization of workflows with easy-to-use applications for the field and office. Strengthen your organization with smart water solutions that will increase efficiency and provide insight for decision-makers. Visit the Esri Water Utilities web site for more information.
Join the Water Utilities Community
Follow #EsriWater on social media: X | LinkedIn
Subscribe to the Water Industry newsletter “Esri News for Water Utilities and Water Resources“
About the author