As the second largest retail water agency in Orange County, California, the Santa Margarita Water District (SMWD) serves over 200,000 residents across nine communities. On average, the district distributes 13 billion gallons of water annually within its 111-square-mile service area. Between its three systems (domestic water, recycled water, and wastewater), SMWD must maintain over 1,700 miles of pipeline and provide service to over 70,000 connections.
The Santa Margarita Water District has undertaken a comprehensive inventory of its network of 60,000+ water service lines, supported by the implementation of the Esri Lead Service Line Inventory solution from ArcGIS Solutions.
Challenge
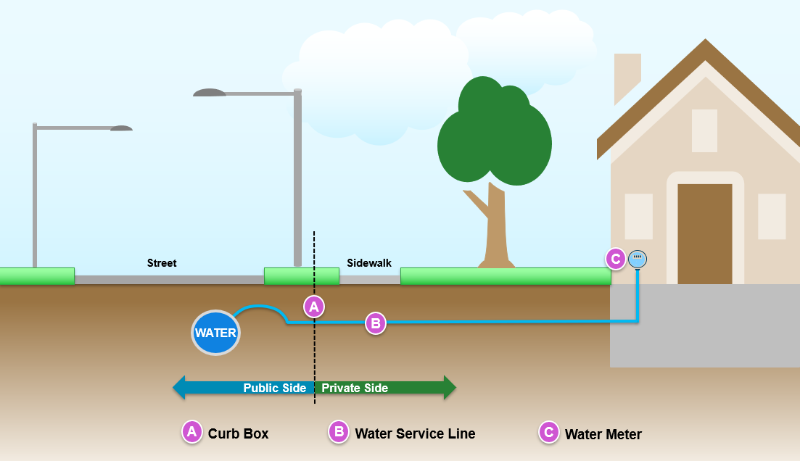
As part of the Lead and Copper Rule Revisions issued by the US EPA (Environmental Protection Agency), a public inventory of service lines was one of the major requirements. These revisions added one specific challenge as it required the utility to inventory both the public and private sides of the service line. In reviewing SMWD’s available construction records, all of the plans showed detailed information on the public side but no information on the private side of the service line. Additionally, the district was in an interesting position given that it had just recently assumed responsibility for the water and wastewater services of a neighboring city, which increased the SMWD’s service connections by 20 percent. SMWD was faced with the monumental task of performing an inventory on tens of thousands of service connections while also performing the initial data review of the neighboring city connections.
Solution
Recognizing the potential to address both challenges effectively, GIS specialist Pilar Yager collaborated with Esri experts to leverage the pre-configured Lead Service Line Inventory solution. Yager saw a benefit in the solution that would help SMWD and reached out to Esri to request a demo. “Instantly, I knew that using data SMWD had, the [Lead Service Line Inventory] solution was promising. The demo helped others at SMWD recognize this as well,” Yager said. By making pertinent adjustments, SMWD was able not only to fulfill Lead and Copper Rule inspection obligations, but also to gather and validate service line data and meter asset information for its internal data integrity initiatives.
I deployed the Esri solution in our ArcGIS Online environment, which worked out very well. The additional fields were easily added to capture the meter box and meter data, exposing the newly added fields took a little configuring.
The Esri solution encompassed a comprehensive array of capabilities, including the establishment of a service line inventory database, integration with various data sources, development of field applications for data collection, creation of progress monitoring dashboards, and formulation of templates for public-facing resources.
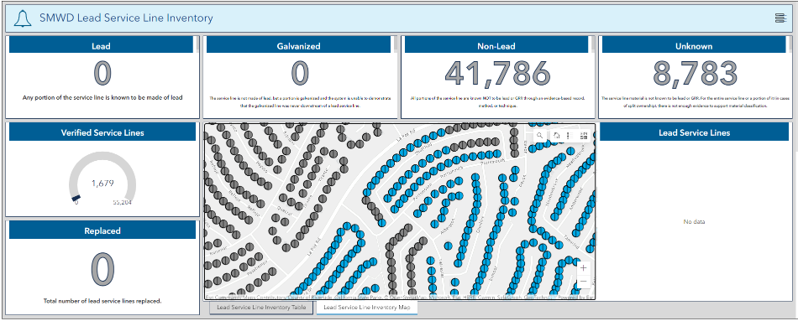
SMWD’s GIS specialist utilized existing customer account information coupled with the County’s parcel data within the Esri geodatabase framework, forming the initial basis of the service line inventory. In coupling the two datasets to support the Lead Service Line solution, it facilitated SMWD’s utilization of exemptions permissible under the Lead and Copper Rule. Notably, using criteria to exclude services exceeding four inches or structures constructed post-1986 reduced the quantity of services that required a physical inspection by over 80 percent due to the age of the SMWD’s service area. Yager was able to couple together the existing district data with the County parcel data, which allowed SMWD to independently verify the construction date of the structures. Using the Esri solution, the data could be reviewed and analyzed, which allowed for a mass exemption of structures built after the 1986 lead ban.
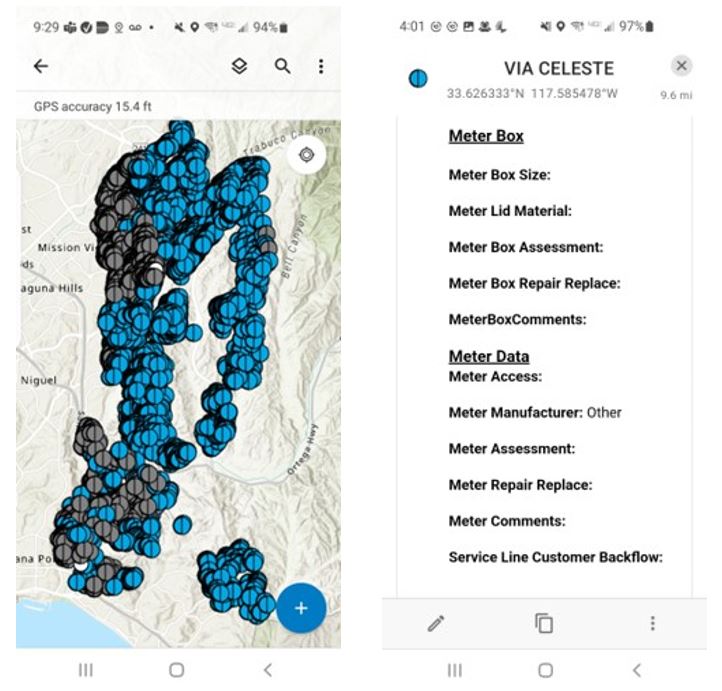
SMWD’s GIS specialist tailored the field mapping features to accommodate the collection of supplementary data fields, facilitating on-site assessments to prioritize maintenance requirements for individual meters, meter boxes, and meter lids. At the time, SMWD was transitioning to Enterprise 11.1, there were so many moving parts. In the interest of time, Yager deployed the Esri solution in their ArcGIS Online environment, which worked out very well. “The additional fields were easily added to capture the meter box and meter data, exposing the newly added fields took a little configuring.” SMWD added custom fields to capture meter and meter box condition and accessibility. By adding these fields, SMWD’s on-site crews could document what issues may be present in locating or accessing the service lines. “Using the Field Maps solution has worked well for us,” Yager said. This field mapping solution was swiftly deployed to field personnel through the ArcGIS Field Maps application, with users rapidly becoming proficient and accelerating the pace of progress. Valuable feedback from field users prompted agile workflow enhancements, promptly incorporated into the system. The data from the field was then included in a new custom dashboard built in ArcGIS Experience Builder, providing SMWD managers with quick identification of areas that would need additional time or resources to complete the work.
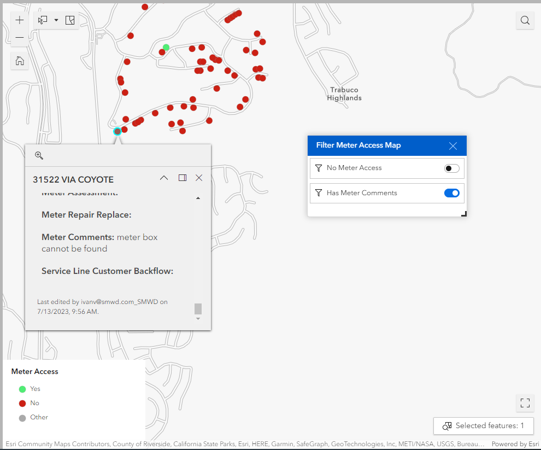
By leveraging the power of the Esri solution, SMWD was able to build off shared insights from peer utilities and Esri. This approach enabled the SMWD to successfully navigate the service line inventory and turn it into a pivotal opportunity for collaboration among GIS and field staff. In unison, the SMWD was able to pool their respective expertise from both the technological aspect and the field observation aspect. The outcome was a collaborative database that met stringent regulatory compliance requirements but also elevated the SMWD’s standards for data precision and regulatory adherence.
Embarking on this project required Yager to complete extensive data mapping to fully utilize the Esri solution. The regulatory intricacies of the lead service line inventory demanded a thorough review and implementation of spatial relationships, data interconnectivity, and meticulous integration work. Leveraging the Esri solution framework, the GIS specialist undertook the significant task of mapping a comprehensive and accurate representation of the SMWD’s water service infrastructure. This intricate data mapping not only laid the foundation for regulatory compliance for the lead service line project but also served as a foundation to allow the SMWD to expand its collaborative efforts, uniting GIS and field staff in a shared pursuit of precision and accuracy.
The utilization of the Esri solution ensured that this project not only met regulatory standards, but showed the transformative impact of leveraging advanced GIS technology for complex challenges.
Results
Implementing the Lead Service Line Inventory solution and performing the service line inventory and physical inspections in house saved SMWD thousands of dollars.
Initial evaluations explored the option of engaging third-party consultants to assist with the desktop analysis and inventory obligations associated with this endeavor. However, the projected costs ranged from $150,000 to $220,000, exclusive of any fieldwork required for inspections. By contrast, the SMWD that integrating the Esri solution and conducting fieldwork incurred an estimated cost of $20,000 in staff hours.
While the District does not anticipate discovering any lead service lines within its operational jurisdiction, the initiative yielded benefits beyond mere regulatory compliance. The meticulous inspections yielded a heightened degree of data precision and validation, in addition to providing valuable insights for future planning through condition assessments. Furthermore, the incorporation of public-facing resources as part of the solution advanced SMWD’s commitment to transparency and accountability in its interactions with the public.
Stay Connected with Esri’s Water Team
ArcGIS is an extensive information system that enables modernization of workflows with easy-to-use applications for the field and office. Strengthen your organization with smart water solutions that will increase efficiency and provide insight for decision-makers. Visit the Esri Water Utilities web site for more information.
Learn more about Esri’s Lead Service Line Inventory solution
Join the Water Utilities Community
Follow #EsriWater on social media: X | LinkedIn
Subscribe to the Water Industry newsletter “Esri News for Water Utilities and Water Resources“


