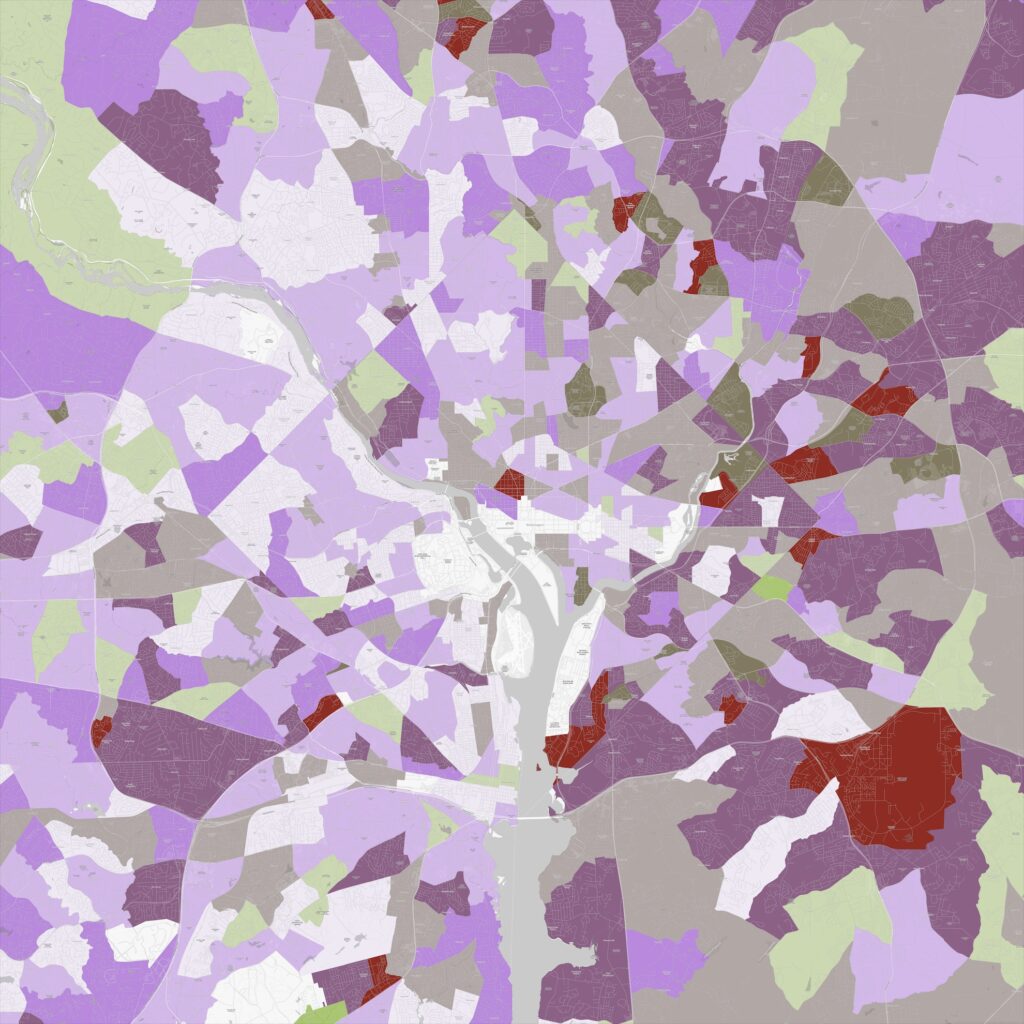
On September 1, 2023, the Federal Emergency Management Agency (FEMA) announced the first round of Community Disaster Resilience Zones (CDRZ). Through an interactive map, created with geographic information system (GIS) technology, the CDRZ platform weighs the risk and vulnerability of communities. It shows zones in 483 communities in all 50 states and the District of Columbia. Each place will receive support and funds—before, during, and after disasters.
A different map came days before, showing record expenses for weather and climate disasters. In 2023, there have been 23 disasters in the US that each cost at least $1 billion—exceeding the average of 8 events per year—and the year isn’t over yet.
In one disaster, the city of Fort Lauderdale had stormwater drainage pipes ready to install when 26 inches of rain fell in 12 hours. The resultant flood reinforced the value of the plan to improve stormwater drainage in a vulnerable community. The city and residents will have to start over, but the area hardest hit is within the city’s two CDRZs. Thanks to this designation, the city can take advantage of prioritized funding and resources to facilitate the rebuilding process. This example illustrates how the city knew its priority places and how a CDRZ designation would have an immediate impact.
We live in a time of more frequent disasters. The CDRZ designations are intended to “buy down” the risk in the places that are more vulnerable. The designation promises to mitigate impacts and help the people who need it most.
Disaster Recovery Reform
The CDRZ initiative signifies a major shift in how organizations leverage data to make informed decisions.
Since the Disaster Recovery Reform Act passed in 2018, FEMA has made significant changes to acknowledge the shared responsibility for disaster response and recovery, reduce the complexity of FEMA, and build national capacity to be resilient to the next catastrophic event. The CDRZ designation and map-based platform achieve each of these reform objectives. Additionally, FEMA policies now require states to consider equity, resilience, and climate change impacts in preparedness, mitigation, and resilience efforts. To help, FEMA has provided data and tools to consider climate forecasts and social vulnerability.
For the initial identification of CDRZ, FEMA referenced the National Risk Index (NRI) and the Climate and Economic Justice Screening Tool (CEJST). These tools include national data on the built environment and demographic data from the 2020 US Census to quantify a community’s vulnerability to hazards.
These tools help state and local governments take a data-driven approach from common national data. By compiling climate risk and vulnerability data themselves, municipalities can achieve greater clarity. As FEMA considers the next CDRZ communities, local needs will be met best by using local data.
Community Dimensions with Data
With billion-dollar disasters occurring at higher frequencies, it is more important than ever to solve the right problems.
According to the Rockefeller Foundation’s 100 Resilient Cities, optimal resilience occurs when preparedness happens at individual, community, and systems levels.
GIS technology stands out as a system that informs other systems. It provides the means to organize location data to inventory and analyze the unique characteristics of a community.
Each community is different, and each experiences complex and nuanced stressors. We must understand what makes communities unique. The answers lie in the data.
GIS allows communities to capture data about their physical, social, and economic challenges. It provides the context to analyze and devise tailored solutions to meet the unique needs of underserved populations.
By incorporating local data, CDRZ resources will go where people need them most and where physical infrastructure faces the greatest threats.

Creating Local Capacity
It is often recognized in the emergency management community that disasters are federally funded, state managed, and locally executed. With the CDRZ program, there’s an opportunity for local jurisdictions to guide the whole process with better data.
FEMA provides direct technical assistance to communities with the CDRZ designation. Providing direct funding to GIS programs for staff training and access to tools could magnify this effort. Skilled local experts can create more accurate datasets that consider local voices.
Over time, communities will create the infrastructure and have the trained staff needed to maintain their community resilience priorities. This data management capacity will ensure that resilience data is current and reflective of community values.
States play an important role in managing data collection and sharing. By leveraging GIS, states can establish statewide data sharing platforms and cooperatives. Through this process, data management standards, processes, and best practices can be followed to ensure that all communities collect and share data in similar ways. The importance of consistency cannot be understated. That’s how FEMA can ensure that the resiliency of each community, county, and state can be compared and how progress can be monitored.
Achieving Resilience with a Geographic Approach
Successful community resilience involves a concerted and ongoing effort to address vulnerable areas and people. Many communities have approached community disaster resilience by mapping the places they want to protect and devising plans that employ place-based strategies.
The Cape Cod Commission launched the Resilient Cape Cod project with climate change strategies focused on protection, accommodation, and retreat. A devastating fire just down the valley from Ashland, Oregon, prompted heightened mitigation measures to harden homes—guided by maps of fire vulnerability—with neighbors helping neighbors. The San Francisco Estuary Institute responded to sea level rise by putting together the San Francisco Bay Shoreline Adaptation Atlas, which shows the best types of shoreline management projects for the physical conditions of each community around the San Francisco Bay. In Boulder, Colorado, a sophisticated model simulated the impacts of future climate change as part of the recovery effort from an unprecedented flood, showing the infrastructure that needs to be reengineered. In Hawaii, the Aloha+ Challenge sets forth sustainability goals that consider equity while improving economic and environmental quality. In Dubuque, Iowa, frequent flooding led to a two-pronged approach to adapting the hard and soft infrastructure of a disadvantaged neighborhood. Homes were removed to install a stormwater drainage system, and social service support was extended to teach skills and find employment for residents.
The work in each of these places preceded CDRZ, and only half have received the designation. In each place, regardless of CDRZ status, the advance work local groups have done to survey community needs will ensure that funds are spent wisely.
Learn more about how location-based solutions drive successful adaptation and mitigation efforts.
Translating Data into Action: In the next blog post, Jeff Baranyi, Esri’s senior technical lead for emergency management, will show how communities can use CDRZ data to identify priority projects to build community resilience.


