We have experienced a lot of change in the way we work, live, and travel. These changes have allowed us to stop and reevaluate the way we used to do things and create a new way of living.
However, new ways of living make this a critical time to really understand who your riders are and how you can better serve their needs. By implementing a geographic approach with Esri’s geographic information system (GIS) technology, users can dive into datasets for any city—you can visualize your community make up across your geography to better understand exactly who travels on your transit lines.
Understanding Your Riders
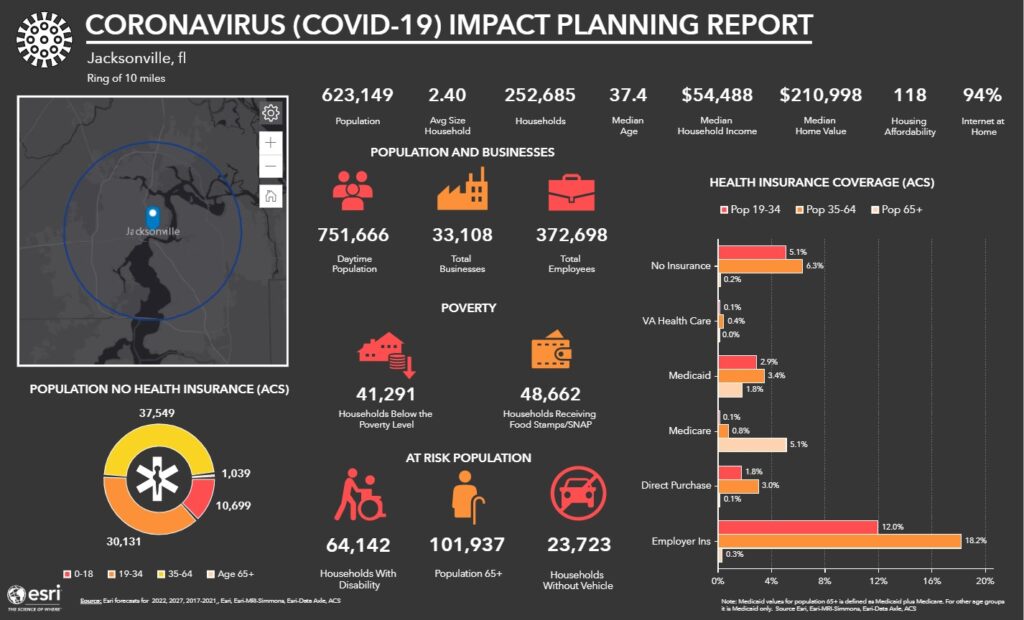
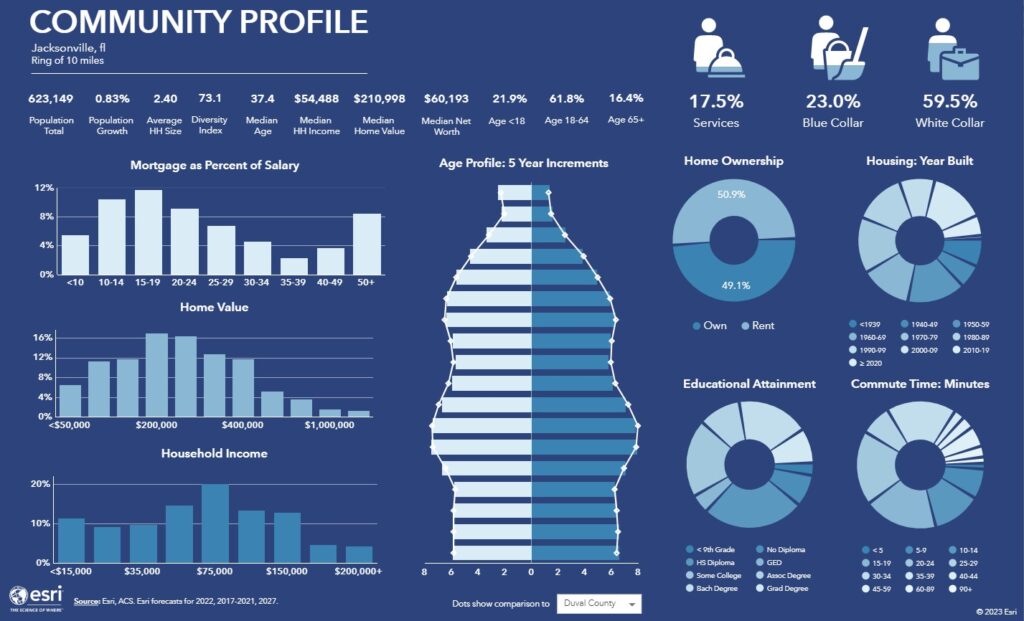
Where exactly do your customers live? Where do they work? How far do they typically travel to get to work? How did the COVID-19 pandemic affect your riders? Who is most in need of access to health-care facilities?
These and many other questions can be answered with ArcGIS® Business AnalystTM. ArcGIS Business Analyst houses a wide variety of infographics that allow you to choose your city and an area of interest to study. You can easily upload and overlay your existing network on a map to create buffers around drive times or even walking times to your stops. Having access to this level of information allows you to make fact-based decisions about adjusting your buses’ availability in certain areas.

Navigating Title VI Geographically
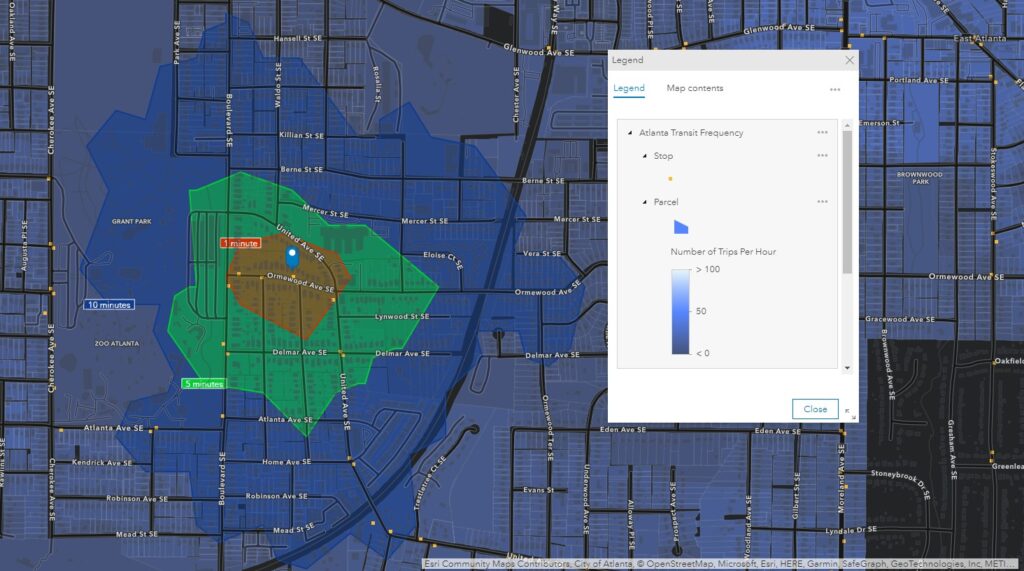
Compliance with Title VI is always at the forefront of how transit agencies provide access to public transportation. The detailed information provided by ArcGIS Business Analyst infographics can speak directly to some of the Title VI requirements. In this example in Atlanta, we show the walk times to a city bus stop, overlaid on how frequently the buses service this area. This level of analysis can be done for any place in your district with any type of geography you’d like to analyze. Publicly available data, like the census and Justice40 Initiative data housed in ArcGIS Living Atlas of the World, can also be applied to your network and queried to help you understand the diversity of your population and geographic access to your services.

Applying a Holistic Lens to Your Community
Many agencies provide multimodal coverage of their cities with light-rail, buses, dedicated on-demand vehicles, and even ferryboats. Esri® GIS technology allows you to overlay all your modes of transportation and provide advanced analytics across the total coverage of transit. You can upload and maintain data or you can connect directly to an existing transit time web service of your routes. This provides constant monitoring and analysis of incidents or route modification plans.
GIS provides a wide variety of products for the transit markets. We can help you get started with simple-to-use online tools or integrate with your established systems to help spatially enable your data.

To achieve a better understanding of your population; create fact-based, actionable information about the spatial layout of your system; or take advantage of constantly updated demographic data for your agency, go to go.esri.com/business-analyst-for-transit.

