Strengthening supply operations during COVID-19
The spread of COVID-19 has led to extreme delivery delays of essential goods, while other non-critical inventories are in stockpiles, not aligned with current demand. To improve supply chain operations, supply network managers must know what is happening and where, including current and projected threats from COVID-19 and weather and traffic conditions. Location-enabled supply network resilience combines live business and spatial data in a common operating picture, which can improve efficiency and reduce costly disruptions.
Digitizing and visualizing supply network and dependencies
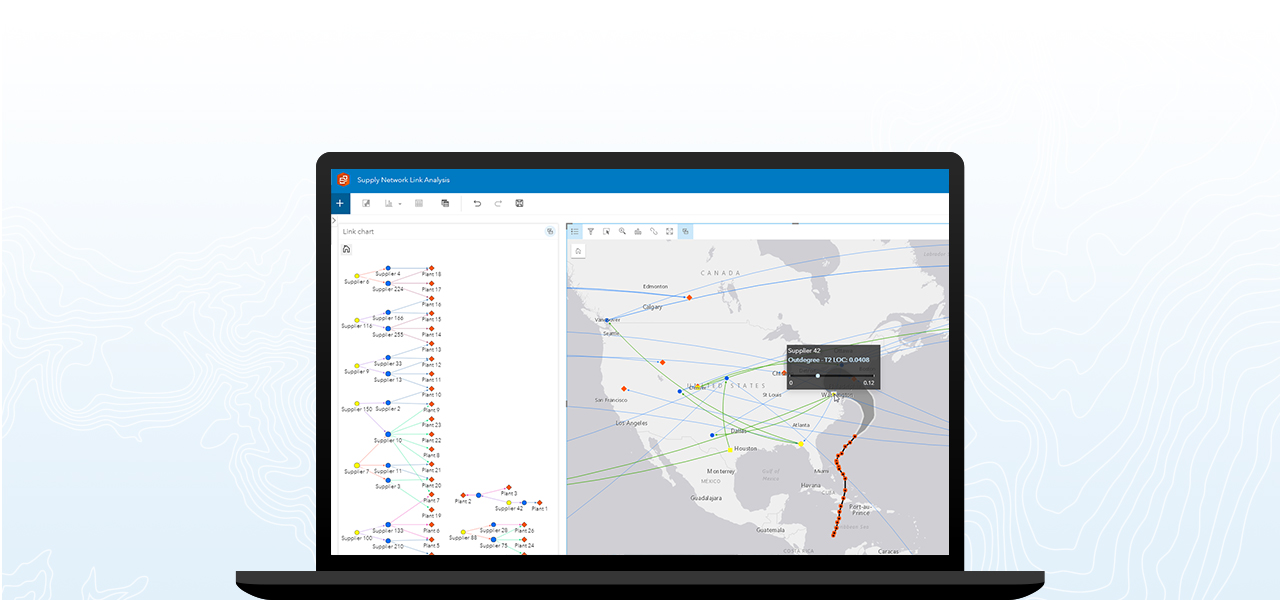
COVID-19 has resulted in unprecedented disruptions for supply chains globally. Like never before, organizations need to understand their end-to-end network and the flow of goods across channels. They must respond to ongoing changes and ensure resources are appropriately allocated to keep business up and running. Organizations can use location intelligence to quickly digitize and visualize every aspect of their supply network—suppliers, plants, distribution, and customers—highlighting any related dependencies to strengthen supply chain resilience.
Assessing network risks and disruptions
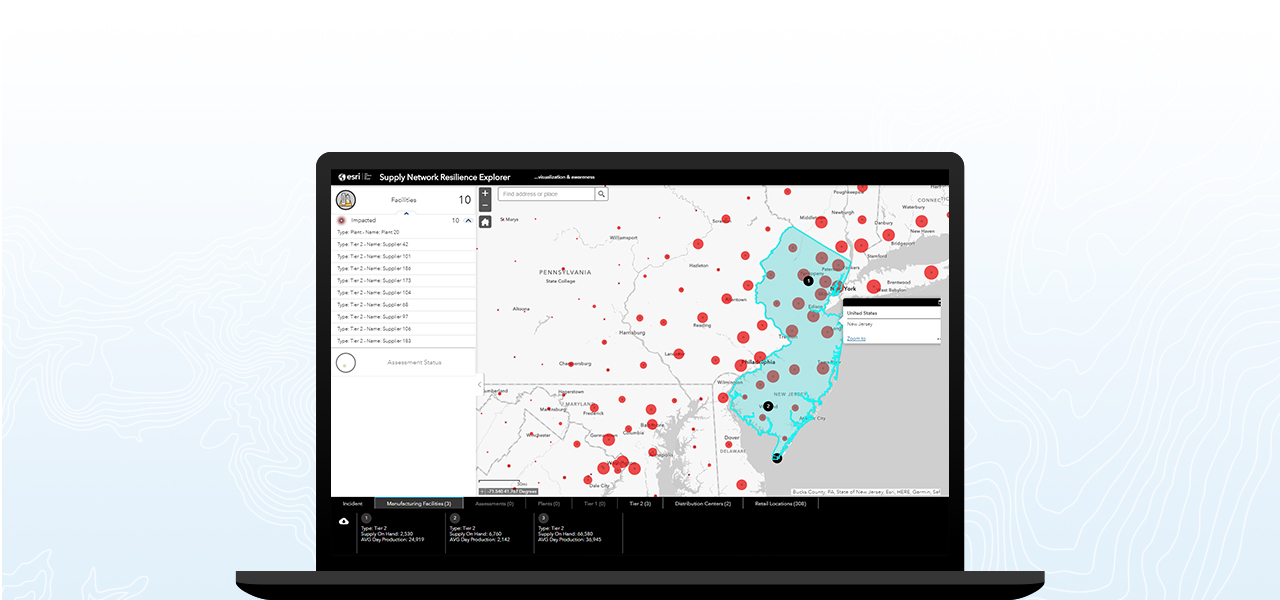
Supply disruptions are inevitable, and during the COVID-19 crisis, operational threats have only increased. Through a live operating picture, staff can immediately identify and assess risks globally, regionally, or hyperlocally. Businesses can examine the impact of the crisis on employee well-being, facility capacities, and policy-based business restrictions, combined with other incidents such as real-time weather and traffic. Organizations can generate a thorough risk analysis to proactively mitigate costly disruptions while maintaining operations to meet shifting demands.
Delivering real-time operations dashboards
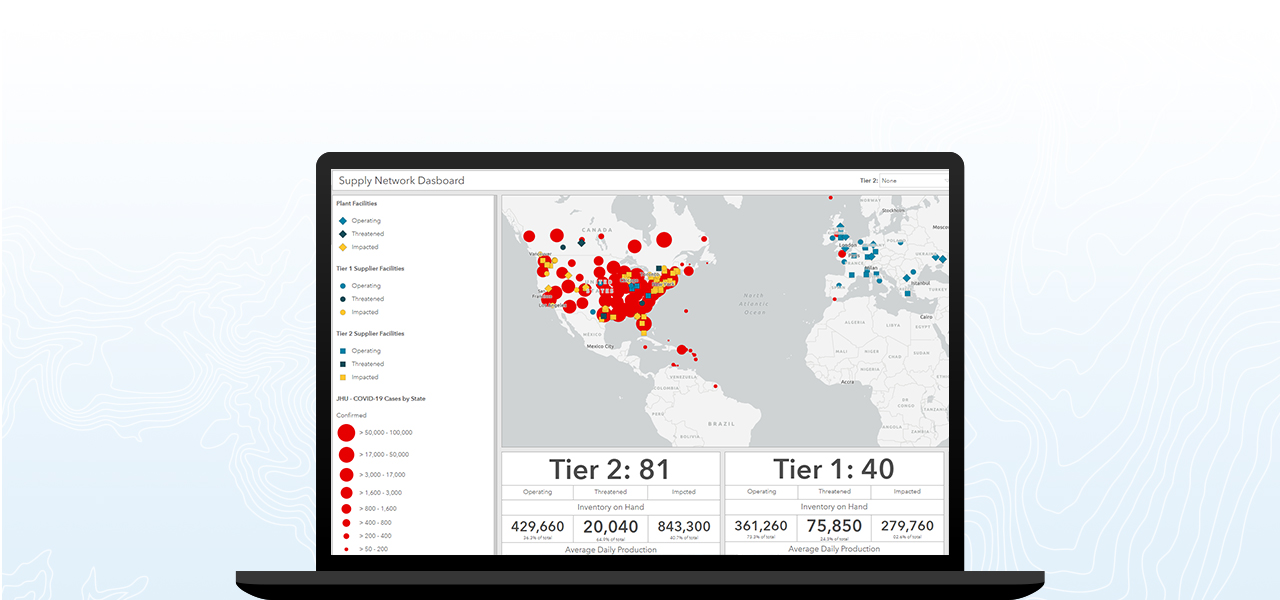
The impact of COVID-19 varies greatly by location and requires up-to-date insights to respond effectively to conditions as they arise. Operations dashboards enable staff to understand how threats impact personnel, operations, and assets. Dashboards help leaders visualize disruptions to network flow by presenting location-specific analytics and performance metrics on a single screen. Throughout the process, organizations with dashboards can be better equipped to make fast, effective decisions; visualize trends; monitor status in real time; and inform internal and external stakeholders.
Requirements
Recommended software
-
ArcGIS Online
ArcGIS Pro
ArcGIS Insights
ArcGIS Dashboards
Additional licenses
-
Creator user type
Viewer user type
GIS Professional user type
Optional software
-
ArcGIS Enterprise
ArcGIS Tracker
Business Resilience Template
Esri products for supply network resilience
Contact sales
Fill out this form, and we will contact you to help you understand how your business can respond to COVID-19.


