Powerful Analytics Using Spatial Data Science

Trusted analytics and spatial data science that push the boundaries of spatial problem-solving

Find the right solution
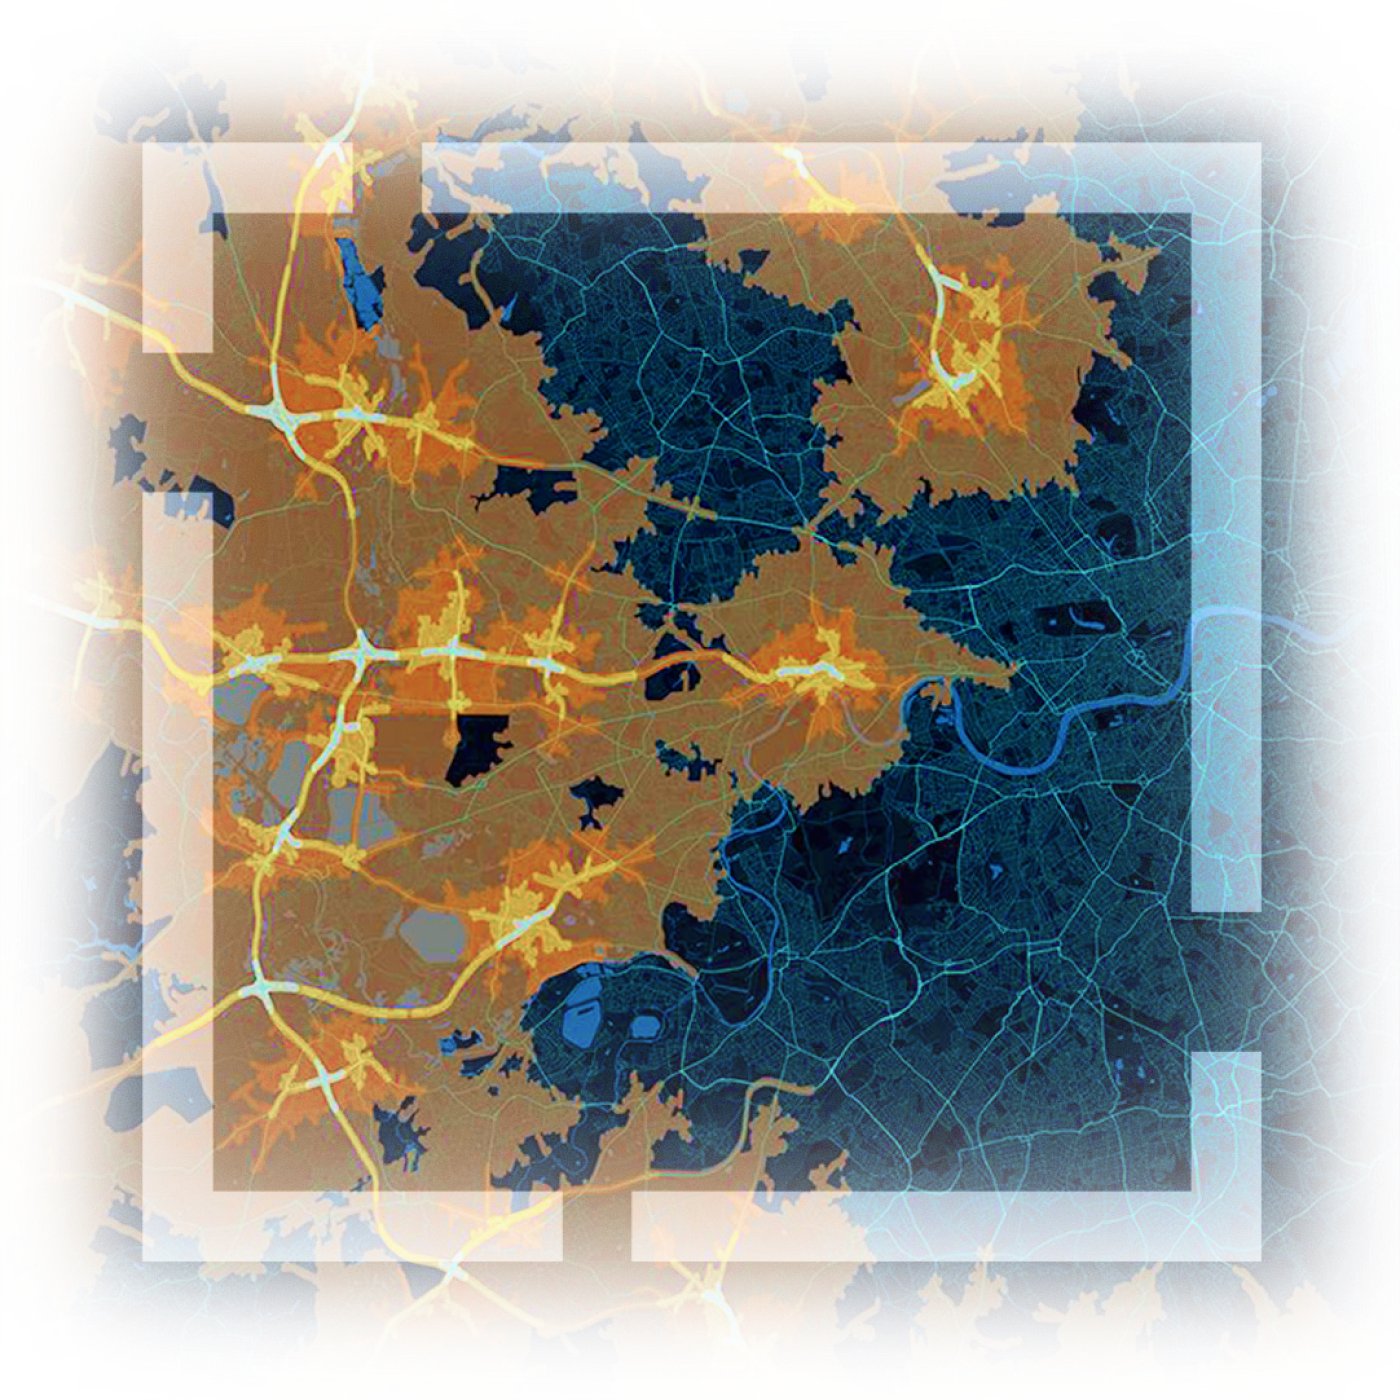
A dark blue map illustrating travel routes in bright yellow with a transparent white square framing the map

INNOVATIVE, SCALABLE, INTEROPERABLE

Simplify spatial problem-solving

At Esri, we understand the complexity that geospatial data can present. That’s why we have developed approachable tools and scalable infrastructure, and also continue to push the boundaries of spatial data science to empower your entire organization to work with geospatial data. ArcGIS meets your organization where it is with simplified operations and methods, seamless integrations, and comprehensive resources to boost confidence and skills.

A comprehensive system for spatial analytics

Gain access to enterprise-grade software with data, methods, and tools to support all types of spatial analytics workflows.

Maintain performance and scale

Transform massive geospatial data into manageable information using distributed architectures to analyze and display large volumes of data.

Leverage existing IT infrastructure and tools

Continue to use the investments you’ve made in scalability and performance. Generate results that can be integrated into third-party systems.

An image of a tall red and white cell tower and green trees in the background

Discover the power of coverage analysis, clustering, and predictive modeling

Telecom companies can use these capabilities to strategically deploy cell towers, optimize antenna placement, and ensure seamless connectivity.

Harness the power of spatial problem-solving

Spatial awareness arises from ongoing inquiry about our past, present, and future surroundings. Transcend the boundaries of business analytics with spatial thinking that helps you understand the interconnectedness of our world.

Understand the where in your data

Watch patterns emerge when you see your assets, customers, performance metrics, and competitors in the context of their location. Use spatial analysis to layer your data on a map, where you can combine and evaluate information to find the answers you need.

Gray map with various sizes of green and orange circles showing the number of customers that responded to marketing channels

Use data to measure the real world

Get to know the spatial characteristics of where your organization or assets operate. Calculate the sizes and distribution of service areas, sales territories, or work sites, as well as metrics like building heights, the distance between assets, and the slope of pathways.

Map showing how far the population can travel using public transportation with areas shaded in blue, purple, red, and orange

See how places and entities relate

Find connections between objects when you geographically explore their proximity, coincidence, intersection, overlap, and visibility. Determine the strength and direction of these newfound relationships to inform decisions related to supply chains, emergency response, or market opportunity.

A map of Oakland, California with various colored polygons illustrating segments of the population

Find the best locations and routes

Perform cutting-edge suitability modeling, site selection, market expansion, logistics, and asset network planning. Explore environmental characteristics and consumer behavior to understand which locations may be more desirable to your research or organization. Optimize ways to get resources where they need to be to maximize efficiency.

A map showing New York population and their estimated highway access in orange and pink

Detect and quantify patterns

Go beyond visualization to find geographic clusters, hot spots, and outliers. Share meaningful analysis with decision-makers that supports them in getting buy-in and informs their next steps.

A map showing the density of store in relation to the proximity of its customers

Make predictions

Use powerful modeling techniques and geospatial artificial intelligence (GeoAI) to understand and predict the environmental, societal, and economic impact of a decision. Create and iterate what-if scenarios, forecast decision outcomes, make accurate performance projections, and more.

A map showing the potential impact of a landslide in blue and green

Thrive within a growing geospatial landscape

As the volume and variety of data evolves, know that the same problem-solving principles shared here can be applied to get the answers you need.

Previous
Next

“[Esri] offers leading data visualization and advanced processing capabilities . . . Esri’s platform acts as a bridge between the weather data providers and business operations. If you have physical assets that could be threatened by climate, Esri can bring the data and processes to bear to target operational resiliency opportunities.”

–The Forrester New Wave: Climate Risk Analytics, Q4 2022

Featured use cases

Previous
Next

Learn how you can apply spatial analytics

Schedule a conversation with one of our experienced sales consultants. Tell us about the workflows you’re trying to improve, and we’ll show you how spatial analytics can support your organization.