Since we have a lot of different product release updates coming at you right before UC, I just want to provide a quick rundown of some of the new features we just released for Web AppBuilder in ArcGIS Online.
In addition to Web AppBuilder now being supported in Hungarian (hu) and Catalan (ca), the main updates have been to the widgets.
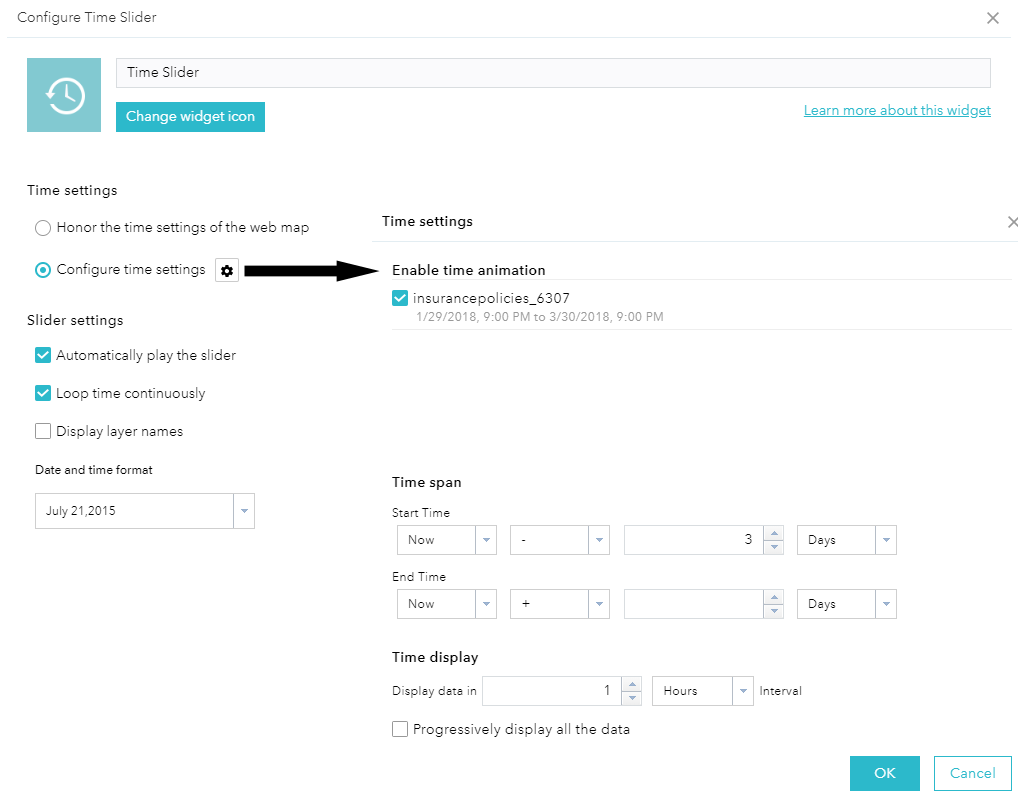
- Time slider has been greatly enhanced with some nice setting options to give you full control of how you want your data to visualize over time. For instance, you can now configure the time span and intervals to animate data as well as the displays of the data in intervals such as days, months, years, minutes, etc. There is also a new slider setting that allows you to enable the slider to continuously loop through your layer or stop once it reaches the end of your date/time series.

- Cost Analysis is officially released and out of beta. If you haven’t used it yet, it is a great tool to assign a cost for a feature. It will automatically calculate the cost associated with each feature and provide an overall cost for your project.
- Edit has added the ability to edit many-to-many related records and control which features to add or delete.
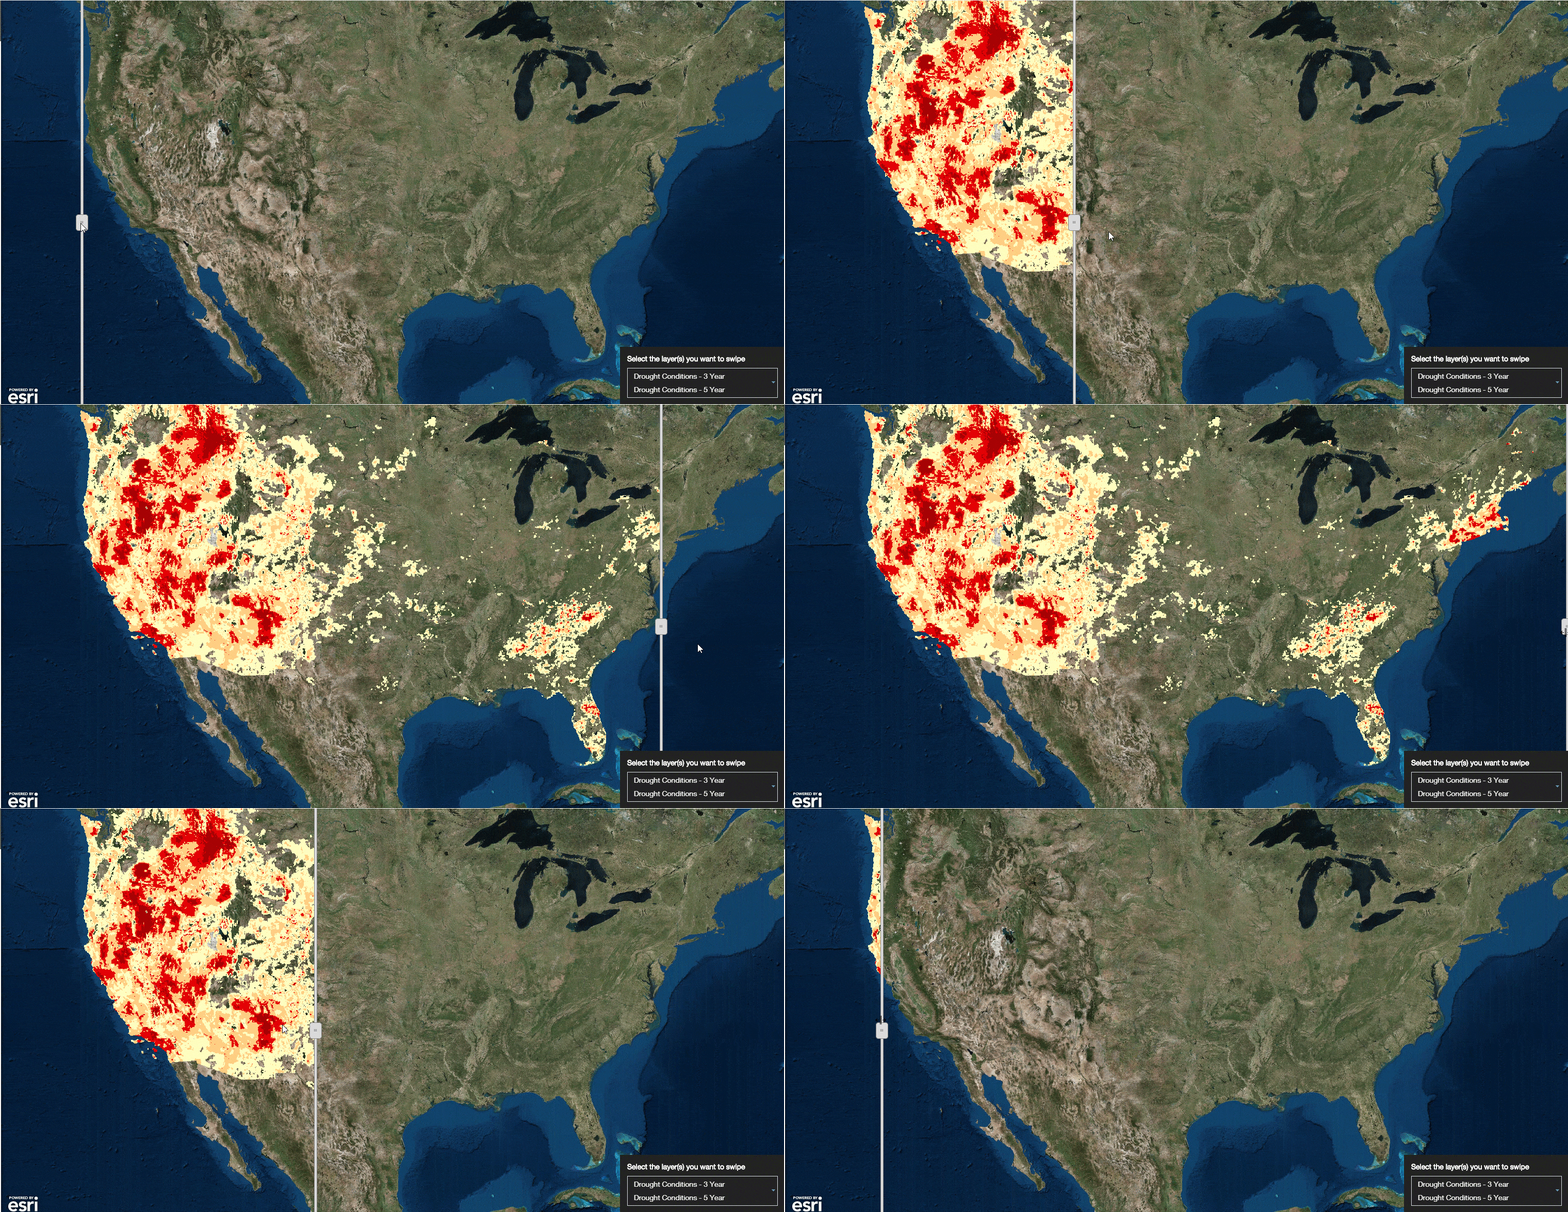
- Swipe now has functionality to swipe multiple layers at a time.

- Attribute Table has a new feature to configure a default sort field.
- Smart Editor allows you to move a point feature to manually entered coordinates or GPS location.
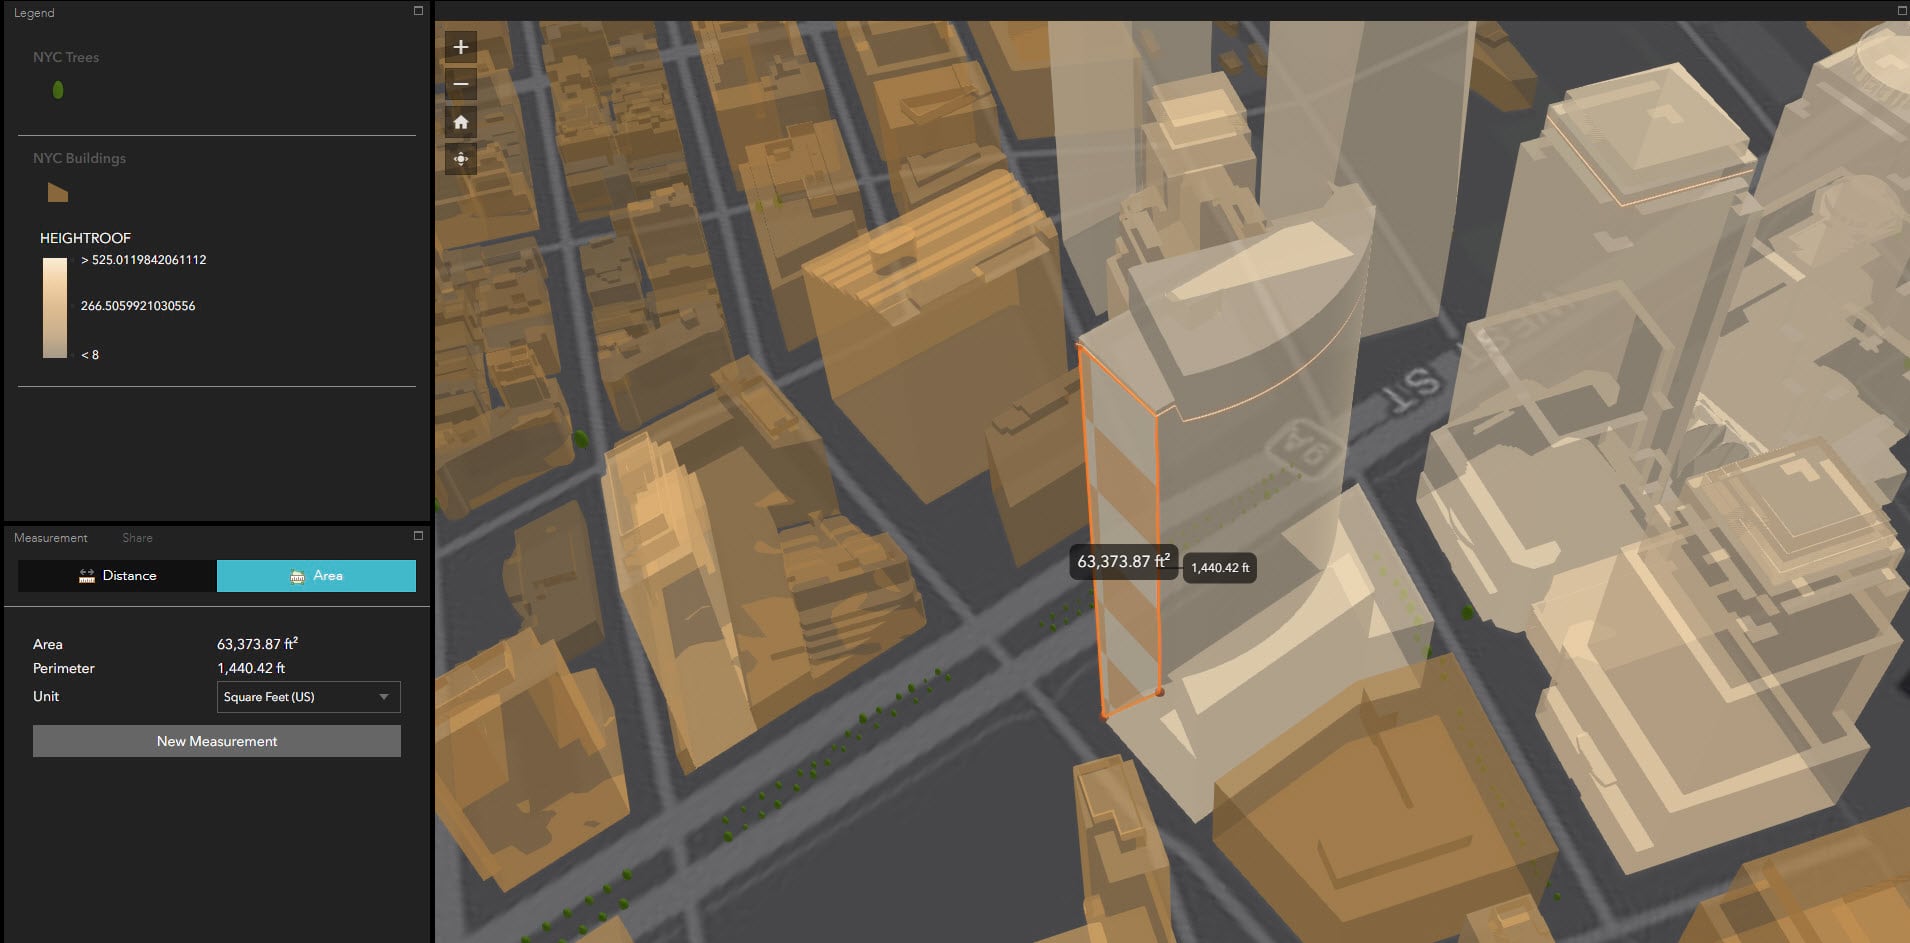
- Measurement 3D can now measure the area and perimeter of a polygon.

- Parcel Drafter enables you to save your last used traverse settings and delete parcels using the delete tool.
- Related Table Charts now gives you the option to select a line chart for your chart types.
- Infographic has added the ability to add line and area markers to your charts. These are particularly useful when you would like to show a baseline or guidelines for your data. We have also added the options to give titles for the x and y axis in your charts.
-

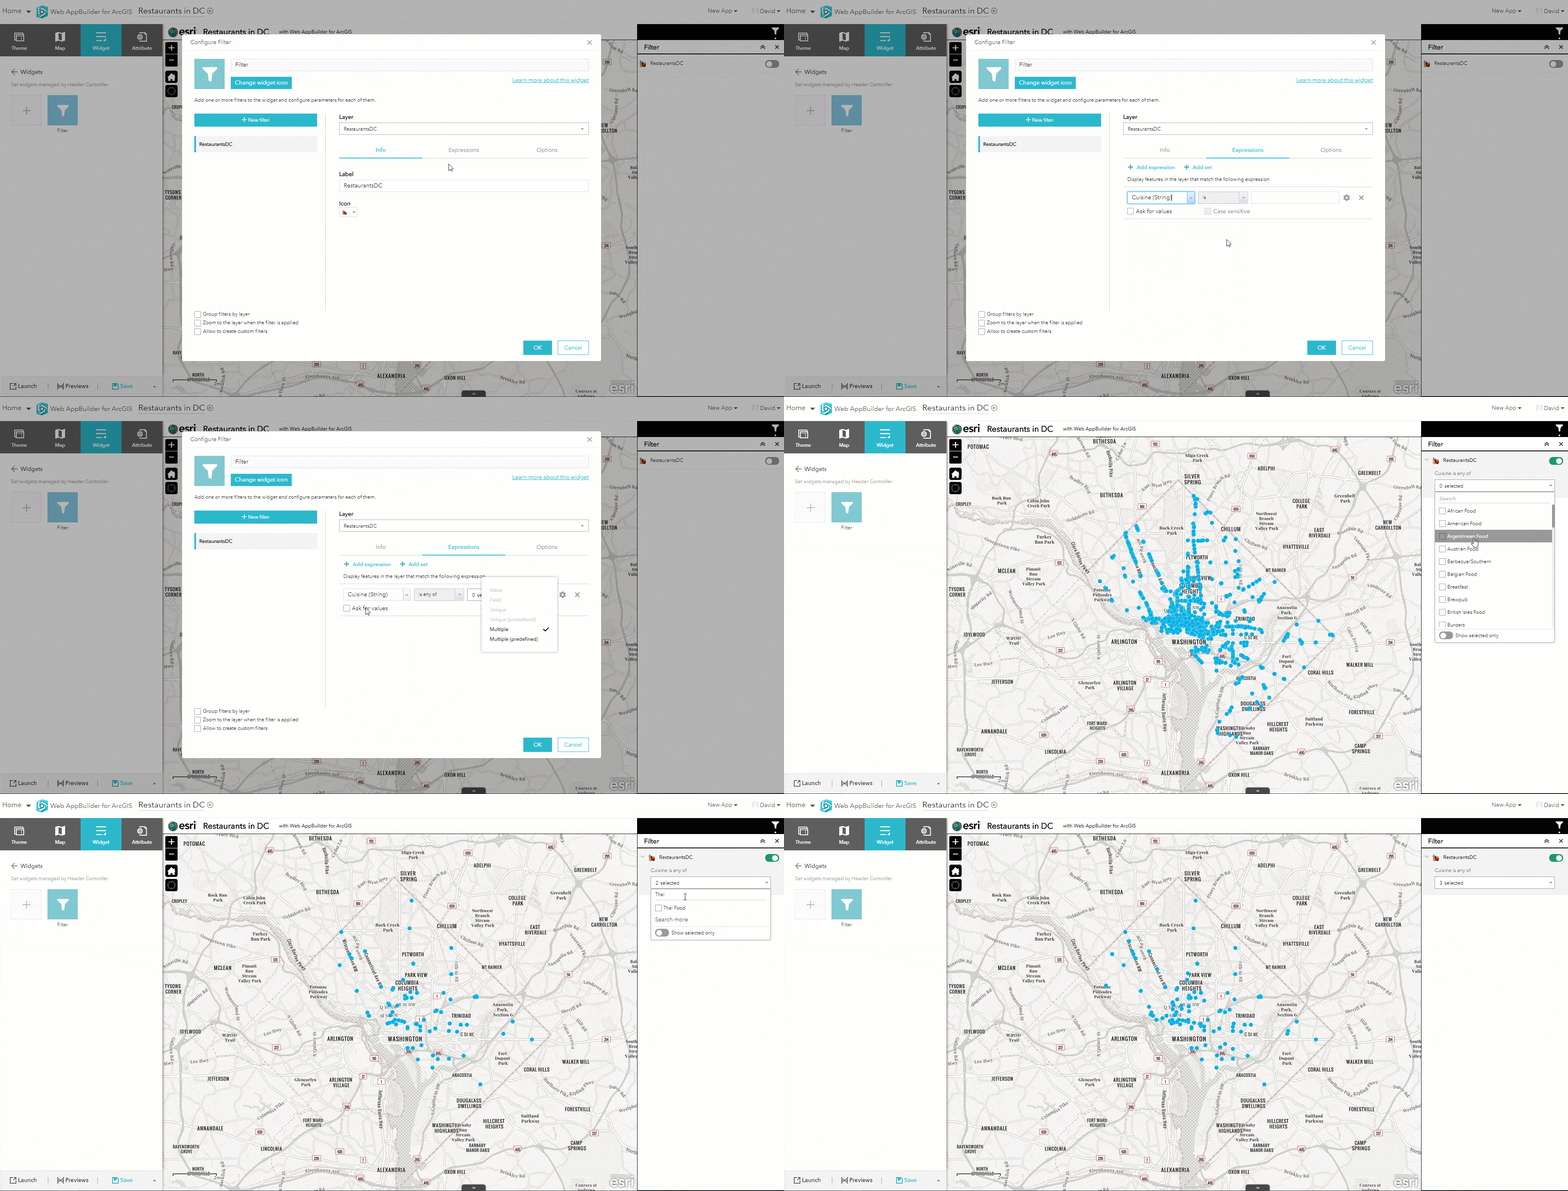
Infographic Widget - Filter has the capability to select multiple values for a field in a single expression. For example, I have a layer with restaurants in Washington D.C., which contains a field with cuisine types and I would like to give users of my application the ability to select multiple cuisine types. To accomplish this workflow, I can configure the widget to display the cuisine types based on the selection of multiple values for that field.

As you can see, we have made lots of enhancements to Web AppBuilder and we hope you find them valuable. For more information on this release see What’s new in Web AppBuilder for ArcGIS
Cheers,
The Web AppBuilder for ArcGIS Dev Team
Commenting is not enabled for this article.